From one loop to a verified graph: graph engineering in Claude Code, read through EIP
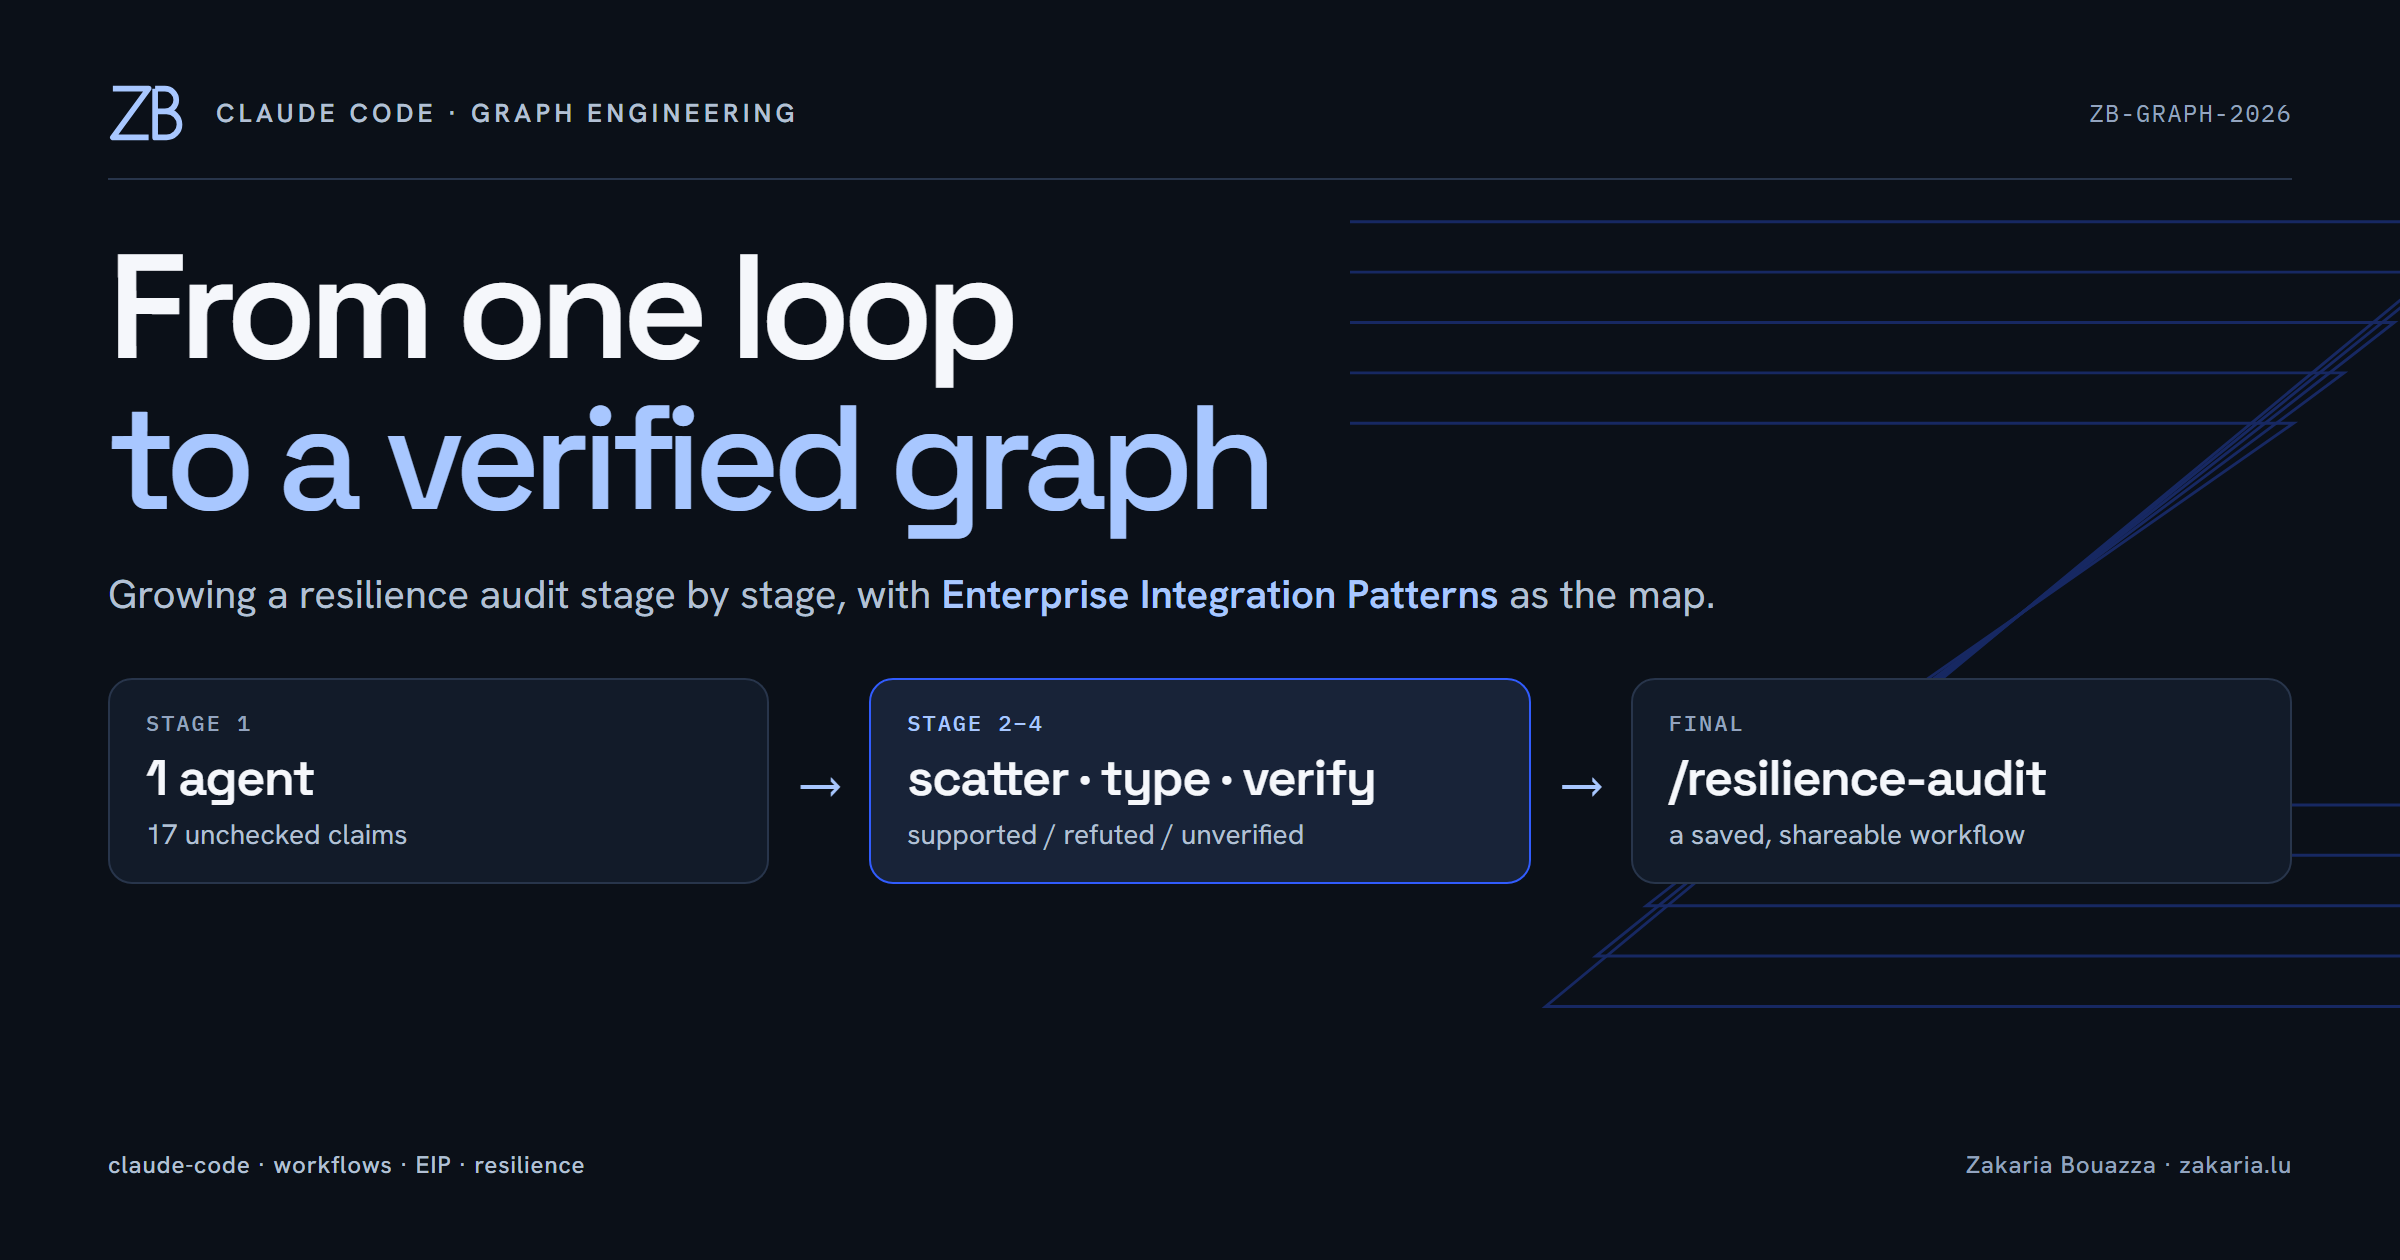
I spend my days on event-driven Java: Spring Boot, Kafka, and a lot of thinking about what happens when a downstream system is slow, wrong or gone. So when people started talking about "graph engineering" for AI agents, I wanted to find out whether it was a new idea or a familiar one with new names. I ran a staged experiment in Claude Code to find out. The short answer: most of it is Enterprise Integration Patterns with an LLM as the processor. The interesting parts are the places where that mapping stops working.
Everything below is from one session. The scripts, raw results, metrics and the answer key are in a public repo: zakariahere/graph-engineering-demo.
The setup: a corpus with a known answer
Auditing a real repository would have told me what the agents found, but not what they missed. So I had Claude seed a small corpus: four Scala/Play and Spring files with 12 planted resilience bugs, plus 5 decoys. A decoy is correct code that looks like a bug, so the gate has something to say no to. The bugs are the ones I see in reviews: a WSClient POST without a timeout, a recoverWith that retries forever, Await.result inside a Future, an empty catch, newCachedThreadPool(), @Retryable(maxAttempts = 10) on a non-idempotent POST. The decoys include blocking {} on a dedicated execution context and a recover that logs and rethrows. The answer key stayed outside the project folder for the whole run, so no auditor could read it. That matters because sub-agents have file access.
The ground rules were strict: read-only on source, at most five files and six agents per stage, cheap model (Haiku) for discovery and the strongest model (Opus) only for verification and synthesis, and a stop after every stage.
The runtime, in four primitives
Claude Code's dynamic workflows are plain JavaScript with a handful of globals. Before writing anything, I listed what the installed version actually offers:
agent(prompt, {schema, model}): one isolated sub-context. With a JSON schema, it returns a validated object. On terminal failure it returnsnull. In EIP terms, a Service Activator.pipeline(items, stage1, stage2…): each item flows through its own chain with no barrier between stages. A Splitter feeding Pipes and Filters.parallel(thunks): a barrier. A failed thunk becomesnull; the call never rejects. Scatter-Gather with an "all" completion condition.- A deterministic body:
Date.now()andMath.random()throw, and there is no filesystem. That restriction is what makes runs resumable.
Nodes are agents or plain code, edges are awaits, and shared state is ordinary variables. There is no declared graph object. The topology is the control flow.
Stage 1: one loop
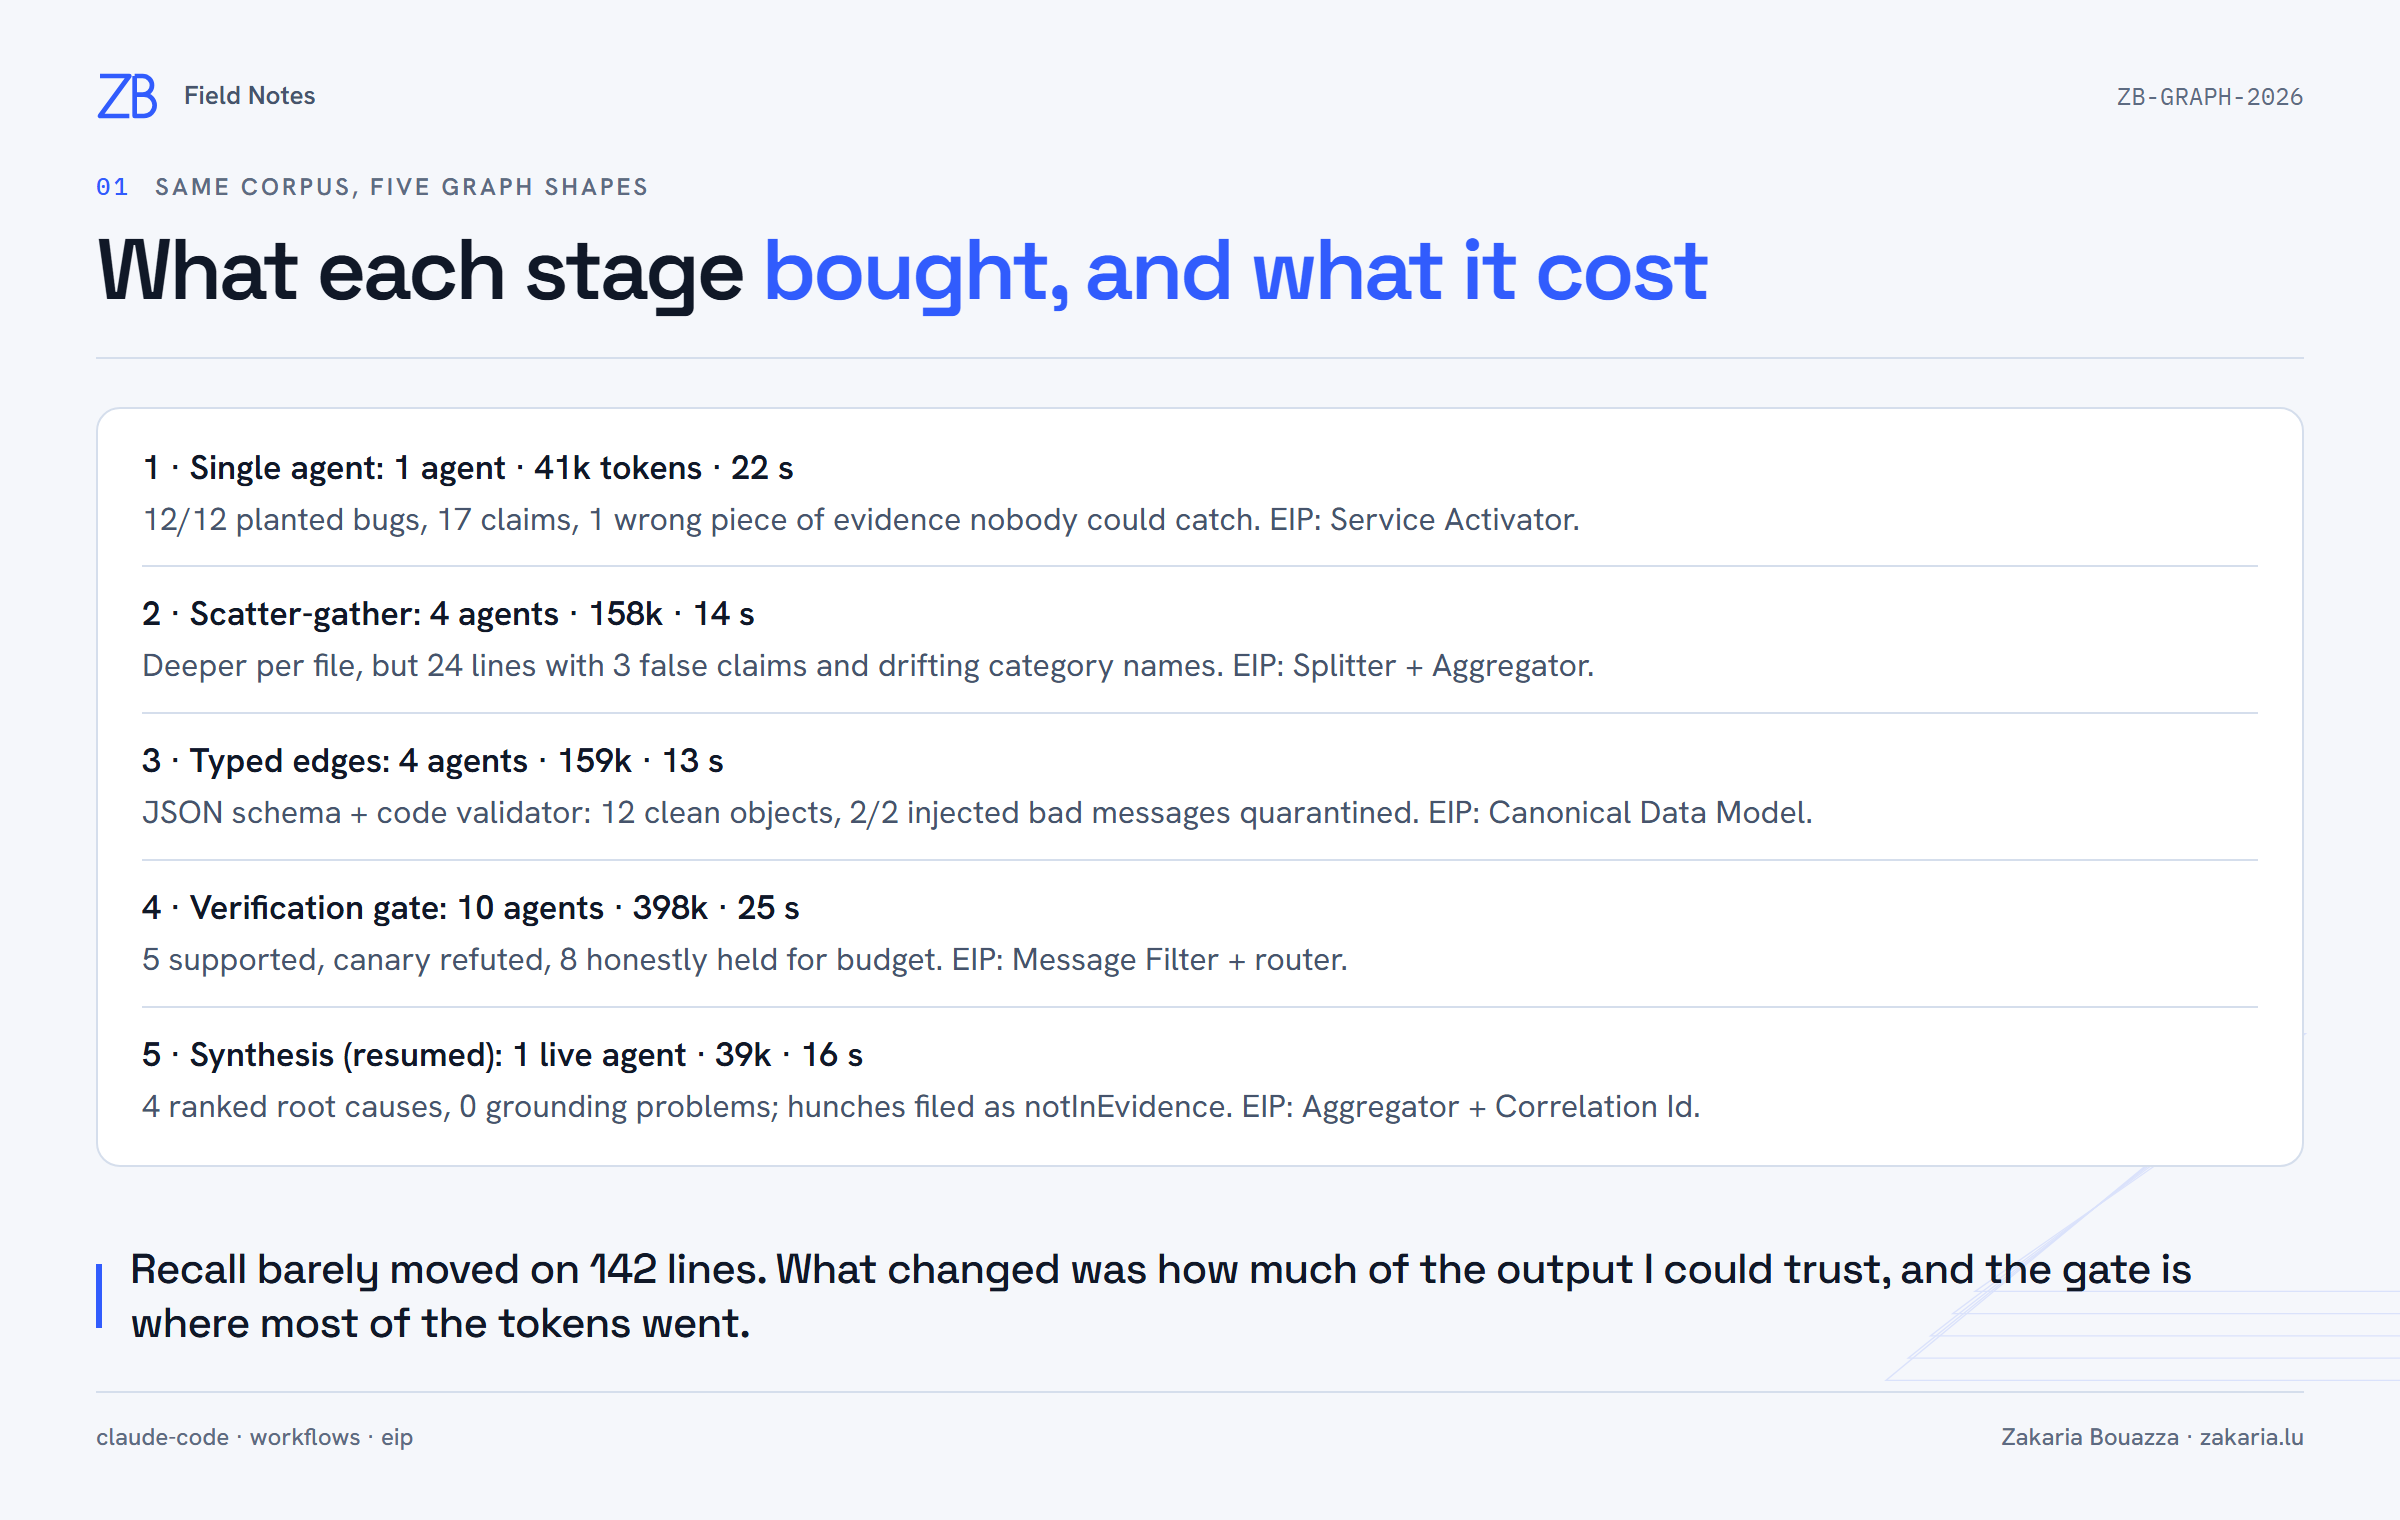
A single agent read all four files: 41k tokens, 22 seconds, 17 findings, and all 12 planted bugs found. On 142 lines, one context is enough. Coverage wasn't the problem. Trust was. One finding claimed Spring Retry fires "immediately", but the default @Backoff is a fixed 1000 ms. The defect was real and the evidence was wrong, and nothing in a one-node graph could notice.
Stage 2: scatter-gather
One isolated auditor per file, joined at a barrier: 4 agents, 158k tokens, 14 seconds. Wall-clock went down and tokens went up 3.8×. Each node pays its own system prompt and tool overhead, the way each split message carries a full envelope on a broker. Per-file attention found more: 24 findings. Three of them were false. My favourite was "inbox.offer()'s return value is ignored, so messages get dropped". On an unbounded LinkedBlockingQueue, offer always returns true. Isolated auditors told to find defects feel pressure to find some. And the join was a pile of strings: the same root cause appeared as naive retry, naive-retry and unbounded retry.
Stage 3: typed edges
I gave the auditor output a JSON schema (file, line, category, severity, evidence, proposedTest), with a closed enum for the category, and added a deterministic validator after each auditor. These are two contract layers, like schema validation on the broker plus business validation at the consumer. The runtime enforces the schema at the tool call and retries the model on a mismatch. My code then checks what a schema can't express: is the path the one this auditor was given, and does the line exist in the file?
function validate(finding, f) {
  const errs = []
  if (finding.file !== f.path) errs.push(`file mismatch: "${finding.file}"`)
  if (!(finding.line >= 1 && finding.line <= f.lines)) errs.push(`line ${finding.line} outside 1..${f.lines}`)
  if (!finding.evidence || finding.evidence.trim().length < 15) errs.push('evidence too short')
  return errs   // non-empty → quarantine[], the Invalid Message Channel
}
I injected two schema-valid but wrong messages: line 999 in a 34-line file, and a wrong-case path with empty evidence. Both landed in quarantine with machine-readable reasons. The cost barely changed (159k), the output halved to 12 well-formed findings, and the false claims from stage 2 had no enum slot to live in. One planted bug went missing in that run, and the wrong "no delay" claim survived inside a proposedTest. A schema checks shape, not truth.
Stage 4: a verification gate that hasn't seen the auditor's reasoning
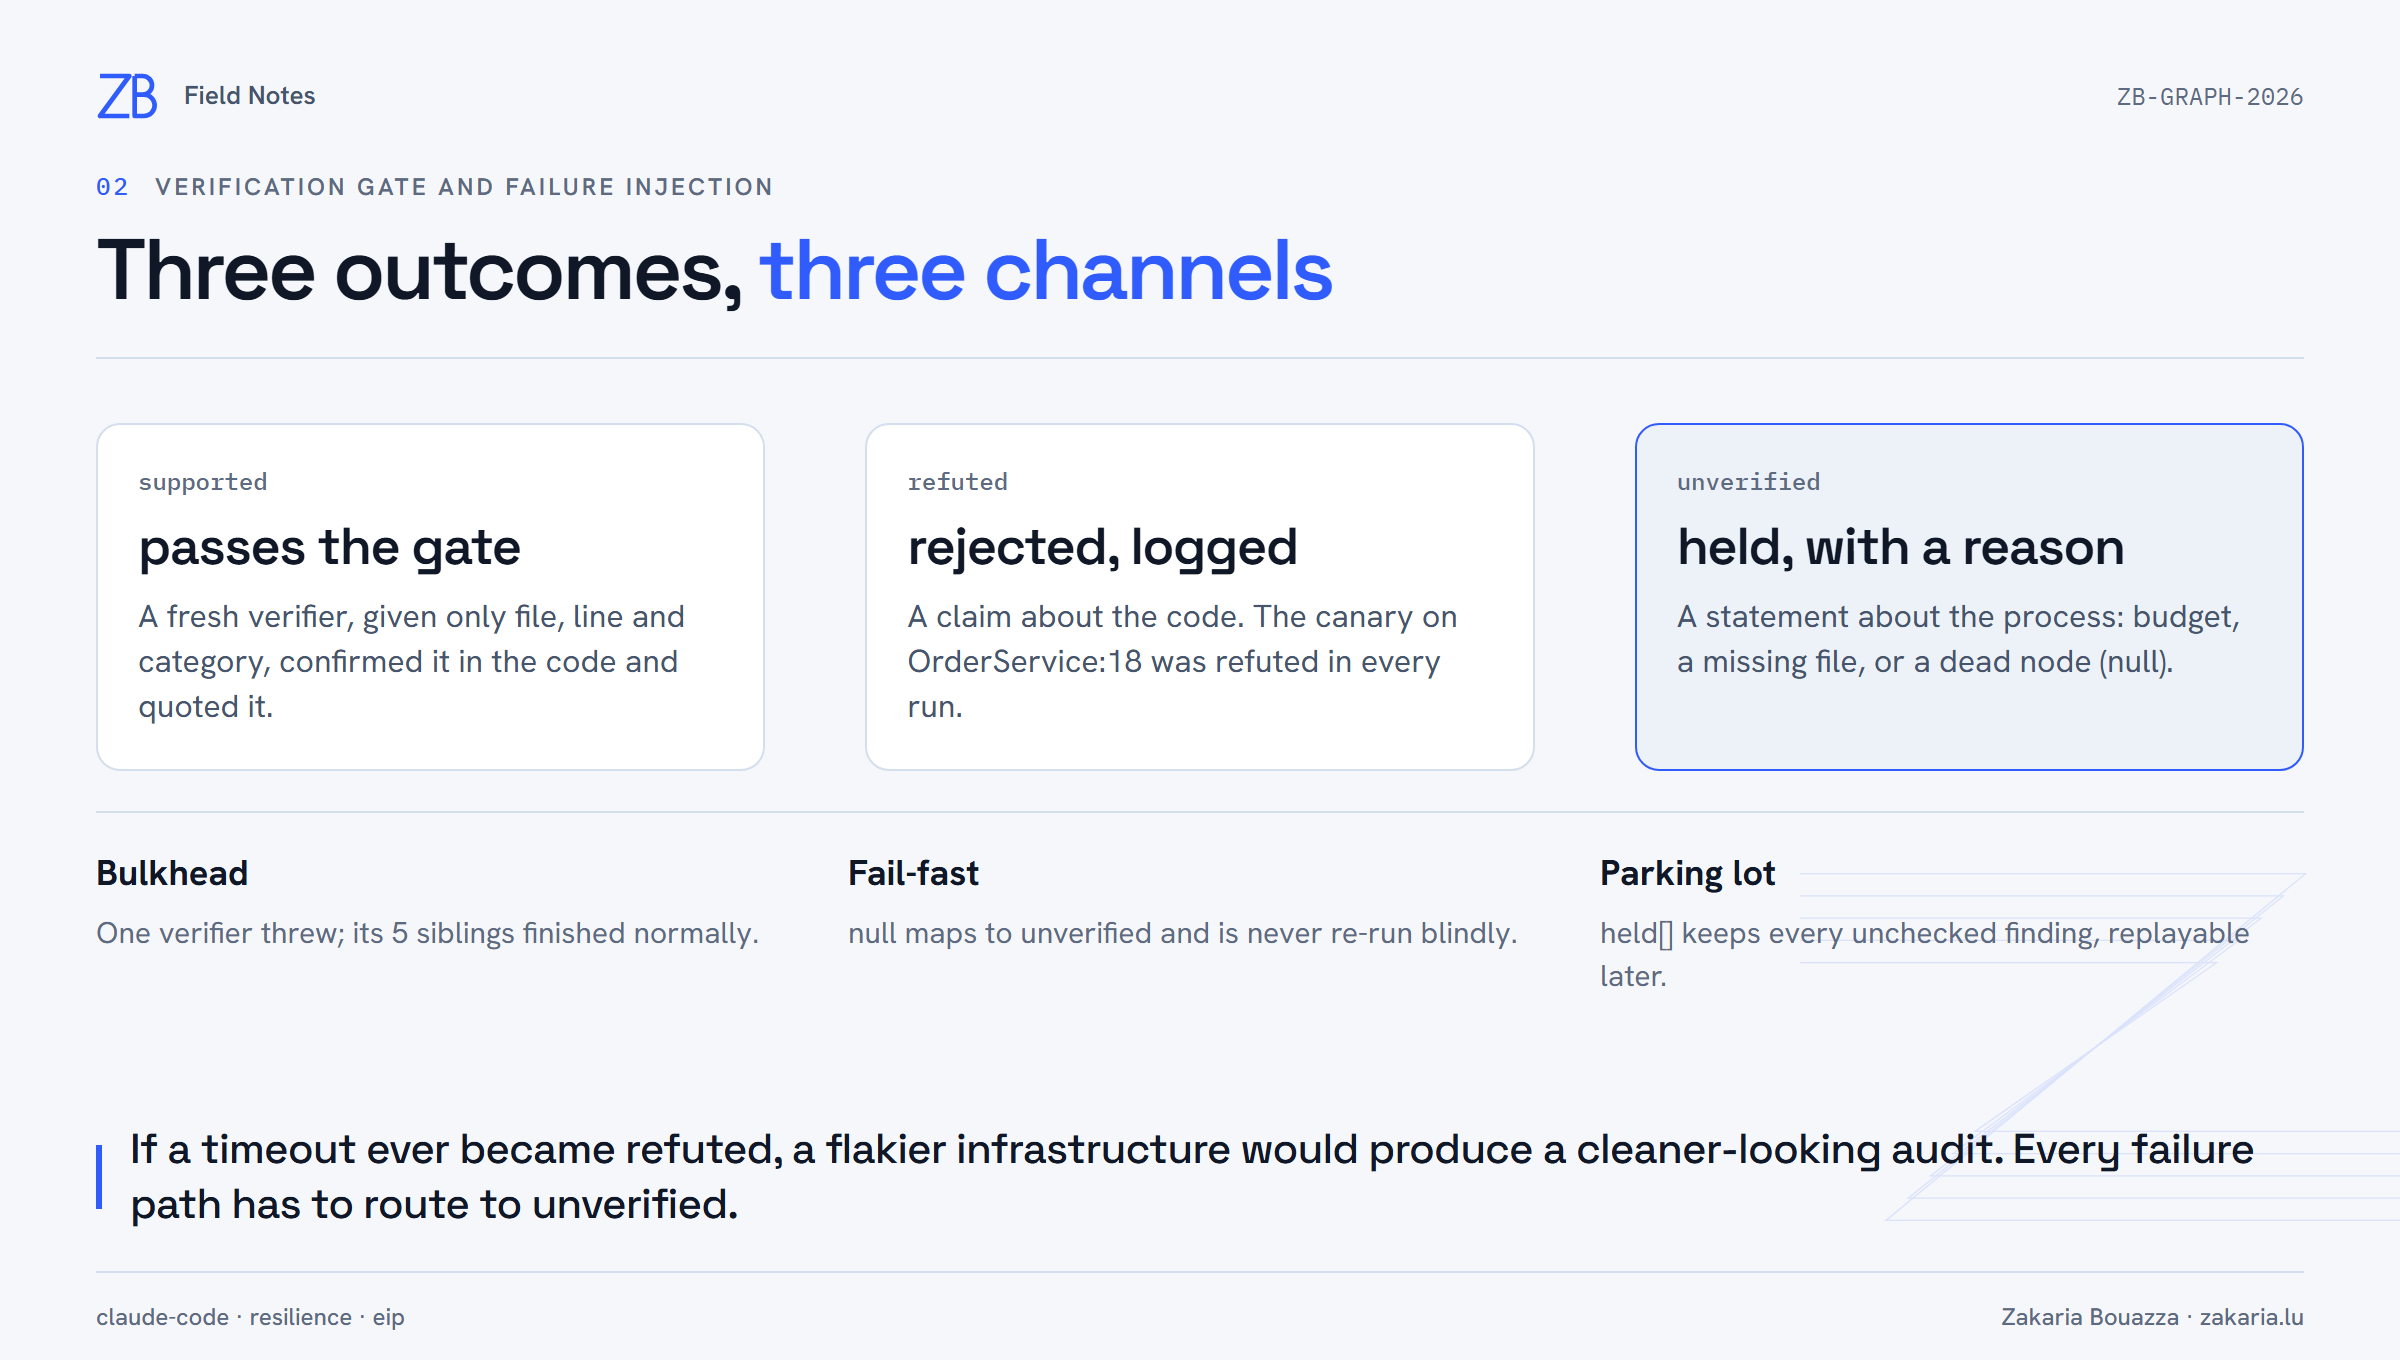
For each finding, a fresh Opus agent gets only category, file and line. It doesn't see the auditor's evidence, test or severity. It is told to falsify the claim, and it must return one of three states and quote the code it read.
const verdicts = raw.map((v, i) => ({ ...toVerify[i],
  verdict: v ?? { status: 'unverified', reasoning: 'verifier node failed (null): infrastructure, not evidence' } }))
const passed   = verdicts.filter(x => x.verdict.status === 'supported')
const rejected = verdicts.filter(x => x.verdict.status === 'refuted')
const held     = [...verdicts.filter(x => x.verdict.status === 'unverified'), ...overBudget]
Why hide the evidence? A verifier that reads the auditor's argument grades the essay instead of reading the code. It starts from the same framing and reaches the same conclusion at twice the cost: a single loop in costume. Independence comes from three things together: a fresh context, information hiding, and an inverted objective.
Because auditors had flagged no decoys, I added a canary: a known-false claim that the blocking {} call on the dedicated executor at OrderService.scala:18 is blocking-in-async. The verifier refuted it, and it did not quietly move the claim to the real defect a few lines up. It pointed there and still refuted the claim as stated.
The six-agent budget forced a global selection: a barrier that is actually justified, because ranking needs the whole set. Result: 10 agents, 398k tokens, 5 findings supported, the canary refuted, 8 held as "not checked: verifier budget". That stage also exposed a bug in my own graph. I ranked by severity, then file path, and app/ sorts before src/, so the Spring files got no verifier at all. Classic starvation. The final version selects round-robin across files.
Stage 5: synthesis with the least freedom
I appended a synthesis node to the stage 4 script and relaunched with resumeFromRunId. The ten unchanged agent calls replayed from the run's journal, and only the new node ran: 39k tokens instead of roughly 400k. If you know Temporal, this is event-sourced replay. It is also why the script must be deterministic.
The synthesizer got correlation IDs F1..F5, no tools, a blast-radius enum and one rule: every claim must cite IDs. Code then checked that every ID exists and every finding is covered exactly once, with zero problems. It merged the missing idempotency key and the unbounded retry into one root cause, which is the merge I would make. It also gave suspicions their own field, notInEvidence, and that is where the most dangerous bug in the corpus ended up. When the 30-second Await times out, the infinite retry may keep running and still charge the card while the order is reported as None. No single node was in a position to verify that, so filing it as a lead was the correct behaviour.
There was one leak. Verifiers had mentioned other defects in passing in their free-text reasoning, and those remarks reached the report even though they never passed the gate. Any free-text field on an edge can carry claims past the gate. The fix in the final version is a Content Filter: verifiers put side remarks in sideObservations[], which is routed to an unverified leads list, and the synthesizer only sees structured fields.
Stage 6: breaking it on purpose
I re-ran stage 4 with three faults. One auditor got a file that doesn't exist. One verifier threw before running, a simulated timeout. One verifier got a "ghost claim" about the missing file. The runtime reported pipeline[1] failed: SIMULATED: verifier timed out, and the four sibling auditors and five sibling verifiers finished normally.
The behaviour that mattered:
- The missing-file auditor reported
fileStatus: "unreadable", a field I added for exactly this, and was quarantined as "coverage gap, NOT clean". Without that field, it returns an empty findings list, and an empty list reads as a clean file. - The thrown verifier's finding, a real planted bug that passed in stage 4, came back as
unverifiedwith an infrastructure reason. Had I mappednulltorefuted, a timeout would have deleted a true bug from the audit. - The ghost-claim verifier chose
unverifiedon its own, and globbed for anything named*Retry*first to make sure the file hadn't just moved.
Read as resilience patterns: a per-item null is a bulkhead, the runtime's internal retries are the retry policy, not re-running a dead verifier is fail-fast, and held[] with reasons is a parking lot you can replay. The rule underneath all of it: if failures can produce refuted, an outage makes your audit look cleaner.
Shipping it as a command
The final graph lives in .claude/workflows/resilience-audit.js. It has fair selection, the fileStatus self-report, null mapped to unverified, side observations routed to leads, an optional canary and the grounding check. I got one thing wrong here. The file was written mid-session, and calling it by name failed with "not found". The docs say the workflow directories are re-read by /reload-skills. After that, it shows up as a slash command:

The final run took 11 agents, 437k tokens and 35 seconds. Every file got at least one verifier, 5 findings were supported, the canary was refuted, and there were 0 grounding problems. The reasons in the report cite only gated findings. There is a cost: the infinite-retry finding was held for budget, so the report lists it as an open question rather than a ranked root cause. That is correct behaviour, and it means you need to size verifierBudget deliberately.
Distribution is just files. A project's .claude/workflows/ is shared through git, ~/.claude/workflows/ holds personal ones, and plugins can ship them namespaced. The /workflows panel shows runs, not definitions:
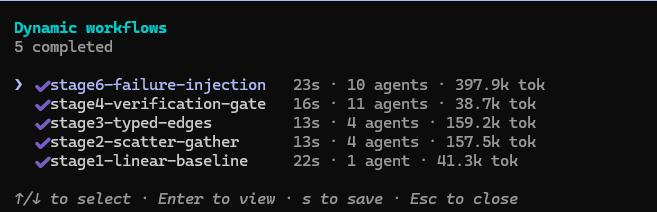
One more thing the panel shows: I launched each stage by hand when I typed "continue". The human gate between stages lived outside the graph, because the runtime has no way to pause mid-run for input.
Where this runtime stops
- No durability across sessions.
resumeFromRunIdworks within the session. The definition is a durable file; the execution is not. - No human input mid-run. Approval gates sit between runs.
- No clock in the script. There are no timers, no backoff you control, and no per-agent timeout option. A dead node is just
null, and the error class shows up in diagnostics, not in your data. - Ephemeral state. Shared state is variables. Anything you want to keep, you write out after the run.
Once a graph needs to survive restarts, wait days for a human signal, own its retry and timeout policies, or perform side effects that must happen exactly once, I would port it to Temporal, or to a Kafka topic per stage with real consumer groups and a DLQ. The schemas, prompts, three-state verdicts and channels carry over unchanged. I treat this runtime as the place to design the graph and find its bugs cheaply, and as a good tool for audits and reviews that finish within a session.
What I'm taking away
On a small corpus, graph shape hardly changes recall. It changes how much of the output you can trust, and how easily you can see where it's wrong. Every bug I found in my own graph (starvation, the provenance leak, a silent empty result) was only visible because some stage turned the data into countable, typed messages. That is the same reason we put schemas on Kafka topics. Agents don't change it.