Metering the agent fleet: cost & metrics for Claude Code subagents
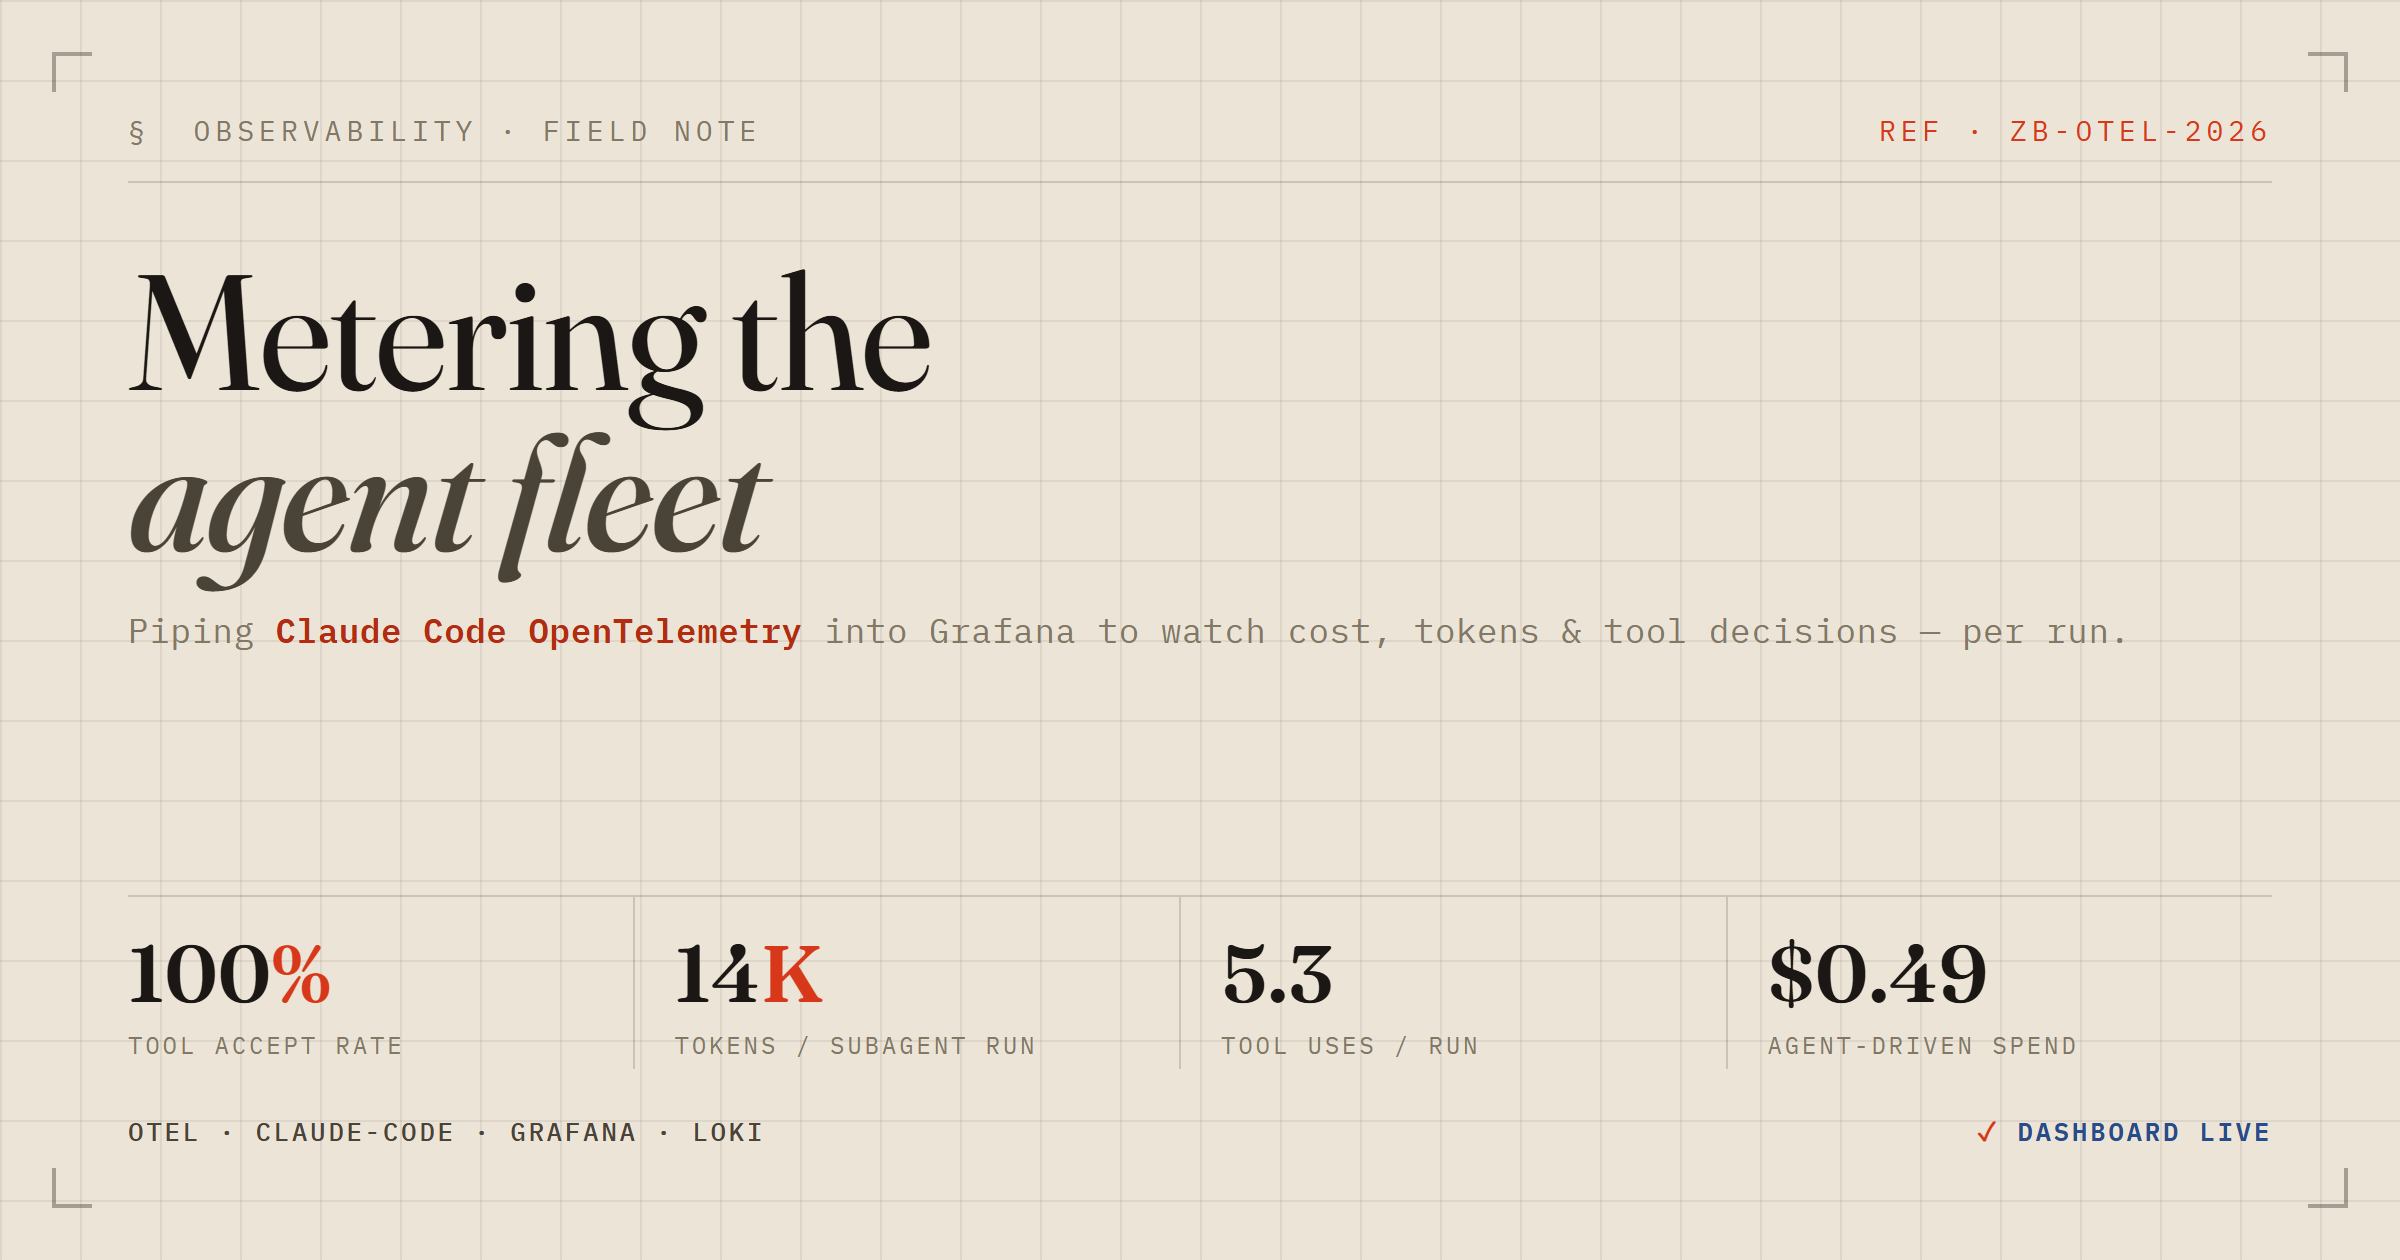
I spend most of my day in regulated banking backends — event-driven Java, Spring Boot, Kafka — where the first question anyone asks a new component is not does it work but how do we watch it in production. So when I started building a small fleet of Claude Code subagents meant to be handed to many developers through a marketplace, the reflex kicked in immediately: an agent you cannot meter is an agent you cannot ship.
This post is the field note from wiring that up. It covers the rationale (why agent cost is a first-class operational concern, not an afterthought), the plumbing (Claude Code's built-in OpenTelemetry into a local LGTM stack), the data model that actually lands, one limitation that shaped every design decision, and a concrete playbook for an AI engineer who is about to distribute an agent and wants to keep an eye on the meter.
Why meter an agent at all
A traditional library you publish is cheap to run and deterministic. A Claude Code agent is neither. Every invocation burns tokens against a model, and tokens are money — real, per-request, compounding money. Worse, the cost is non-deterministic: the same task can cost 3× more on a bad day because the agent read more files, retried a tool, or escalated to a larger model. Multiply that by “many developers on a marketplace” and you have a spend curve nobody owns unless you build the instrument to see it.
There is a second, subtler reason. When you distribute an agent, you are also distributing a behaviour. Is it accepting its own tool calls or getting rejected? Is it thrashing on Reads? Is the sub-agent that is supposed to be a cheap reviewer quietly running on your most expensive model? None of that shows up in a star rating. It shows up in telemetry.
My test bed was foraicc: a deliberately minimal FastAPI “tasks” service that exists purely as real work for a trio of subagents — a feature-builder, a test-writer and a code-reviewer, coordinated by a foraicc-lead orchestrator. The code is throwaway. The point is the exhaust it produces.
The plumbing: Claude Code already speaks OpenTelemetry
The nice surprise is that you do not need a proxy or an SDK shim. Claude Code emits OpenTelemetry natively — you just turn it on with environment variables. I put mine in the project's .claude/settings.json so every developer on the repo inherits the same wiring:
{
  "env": {
    "CLAUDE_CODE_ENABLE_TELEMETRY": "1",
    "OTEL_METRICS_EXPORTER": "otlp",
    "OTEL_LOGS_EXPORTER": "otlp",
    "OTEL_EXPORTER_OTLP_PROTOCOL": "grpc",
    "OTEL_EXPORTER_OTLP_ENDPOINT": "http://localhost:4317",
    "OTEL_METRIC_EXPORT_INTERVAL": "10000",
    "OTEL_LOGS_EXPORT_INTERVAL": "5000",
    "OTEL_METRICS_INCLUDE_SESSION_ID": "true",
    "OTEL_RESOURCE_ATTRIBUTES": "team.id=foraicc-demo,service.namespace=foraicc-otel-demo,deployment.environment=demo",
    "OTEL_LOG_USER_PROMPTS": "1"
  }
}
Two things worth calling out. Claude Code ships two signals: pre-aggregated metrics (counters like cost and token totals) over OTLP, and a rich stream of events as logs — one structured record per API request, per tool result, per sub-agent completion. The second stream is the interesting one for evaluation, because it keeps per-occurrence granularity instead of collapsing everything into a counter. And the OTEL_RESOURCE_ATTRIBUTES line stamps every record with a namespace and environment, which is exactly how you would separate one distributed agent from another in a shared backend.
For the backend I used the grafana/otel-lgtm image — a single container that bundles an OpenTelemetry Collector, Loki (logs), Grafana, Tempo (traces) and Mimir/Prometheus (metrics). One file:
services:
  lgtm:
    image: grafana/otel-lgtm:latest
    ports:
      - '3000:3000'   # Grafana UI
      - '4317:4317'   # OTLP gRPC
      - '4318:4318'   # OTLP HTTP
Bring it up, restart Claude Code so it re-reads the env, do some work, and the exhaust starts flowing.
What actually lands — and where
Here I hit the first honest gotcha, the kind you only find by looking rather than assuming. The claude_code_* Prometheus metrics had not flushed yet on my short session — but the events were already in Loki, tagged service_name="claude-code". So rather than wait on counters, I built the whole dashboard off the event stream, which is both faster to populate and richer.
Instead of guessing at field names, I queried the datasource directly through Grafana's API and aggregated what came back. Every Claude Code event carries a fat set of structured metadata. The ones that matter for evaluation:
api_request—cost_usd,input_tokens,output_tokens,cache_read_tokens,cache_creation_tokens,model,duration_ms, andquery_source.subagent_completed—duration_ms,total_tokens,total_tool_uses,agent_type,agent_source,model. One record per sub-agent run.tool_resultandtool_decision—tool_nameanddecision(accept / reject). Your behavioural signal.
A subtlety that trips people up: in Loki only three of these are indexed labels (service_name, service_namespace, deployment_environment). Everything rich — cost, tokens, source — is structured metadata. You can still filter and do maths on it, but through LogQL after the stream selector, not through the label API. That distinction drives every query below.
The limitation that shaped the whole design
Now the finding I care most about, because it is the one an engineer building for a marketplace must know before promising per-agent leaderboards.
Claude Code's telemetry (v2.1.x) does not emit the individual sub-agent's name. Agent-driven work is tagged only asquery_source="agent:custom"andagent_type="custom". You can cleanly separate agent work from main-thread work, and you can measure per-run performance — but you cannot, out of the box, attribute a metric back to “feature-builder” specifically.
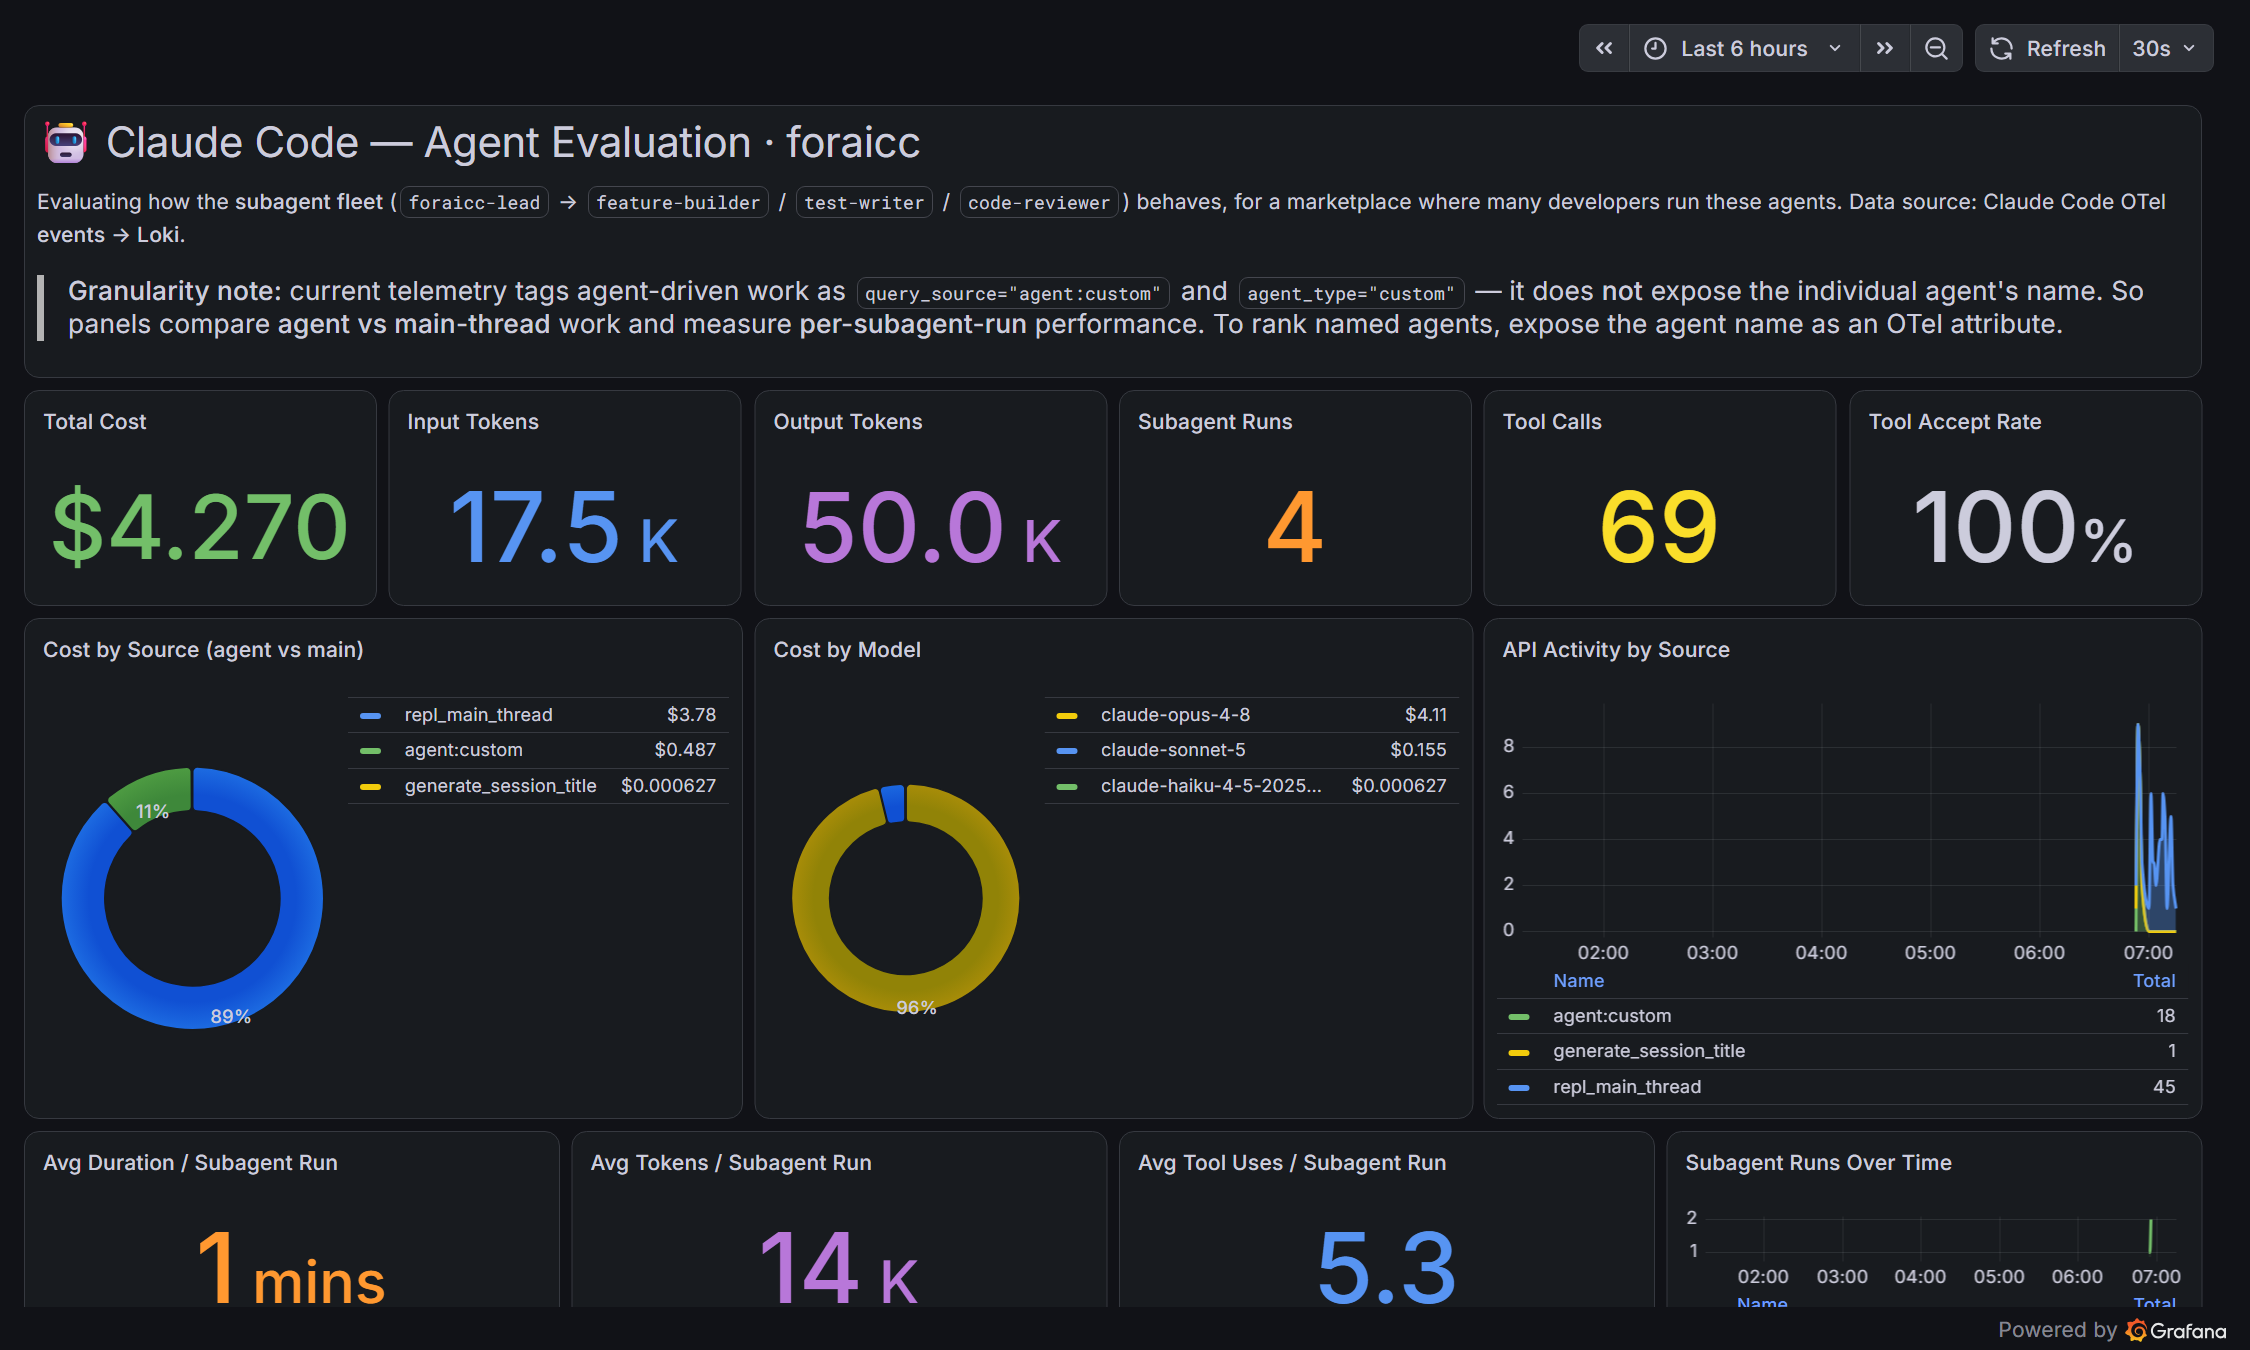
That is not a dead end, it is a design constraint. It means the honest axes of evaluation today are agent vs. human/main-thread (via query_source) and the distribution of per-run cost, tokens and tool-use (via subagent_completed). If you genuinely need named-agent rollups, the workaround is a Claude Code hook — a SubagentStop or PreToolUse hook that annotates events with the agent name before they leave the process. I put a “granularity note” right on the dashboard so nobody reads a chart as something it is not; you can see it in the header below.
Building the dashboard as code, not clicks
I did not hand-build fifteen panels by dragging in the UI. I authored the dashboard as JSON and POSTed it to Grafana's HTTP API (/api/dashboards/db), which is repeatable, diffable, and far less error-prone. The panels all query Loki. The canonical shape for a cost number over the picker window is a LogQL range aggregation with an unwrap:
# Total agent-driven cost, broken down by source (agent vs main-thread)
sum by (query_source) (
  sum_over_time(
    {service_name="claude-code"}
      | event_name=`api_request`
      | unwrap cost_usd [$__range]
  )
)
Two Grafana + Loki gotchas cost me a rebuild each, so here they are so they cost you nothing:
- Pie and time-series panels need
queryType: "range", not"instant". With an instant query, Loki collapses theby (...)series labels and every slice comes back as a single anonymous “Value #A”. Switch to range and the labels (source, model) come through. - A categorical bar chart needs a range query plus a Reduce transformation (
mode: seriesToRows,reducers: ["sum"]) withxFieldset to the label field. Without it, the bar chart renders one bar per time bucket — a wall of timestamps instead of one bar per tool.
Reading the meter as an evaluator
With data flowing, the dashboard starts telling a story. A few reads from this session that generalise to any distributed agent:
Where the money actually goes
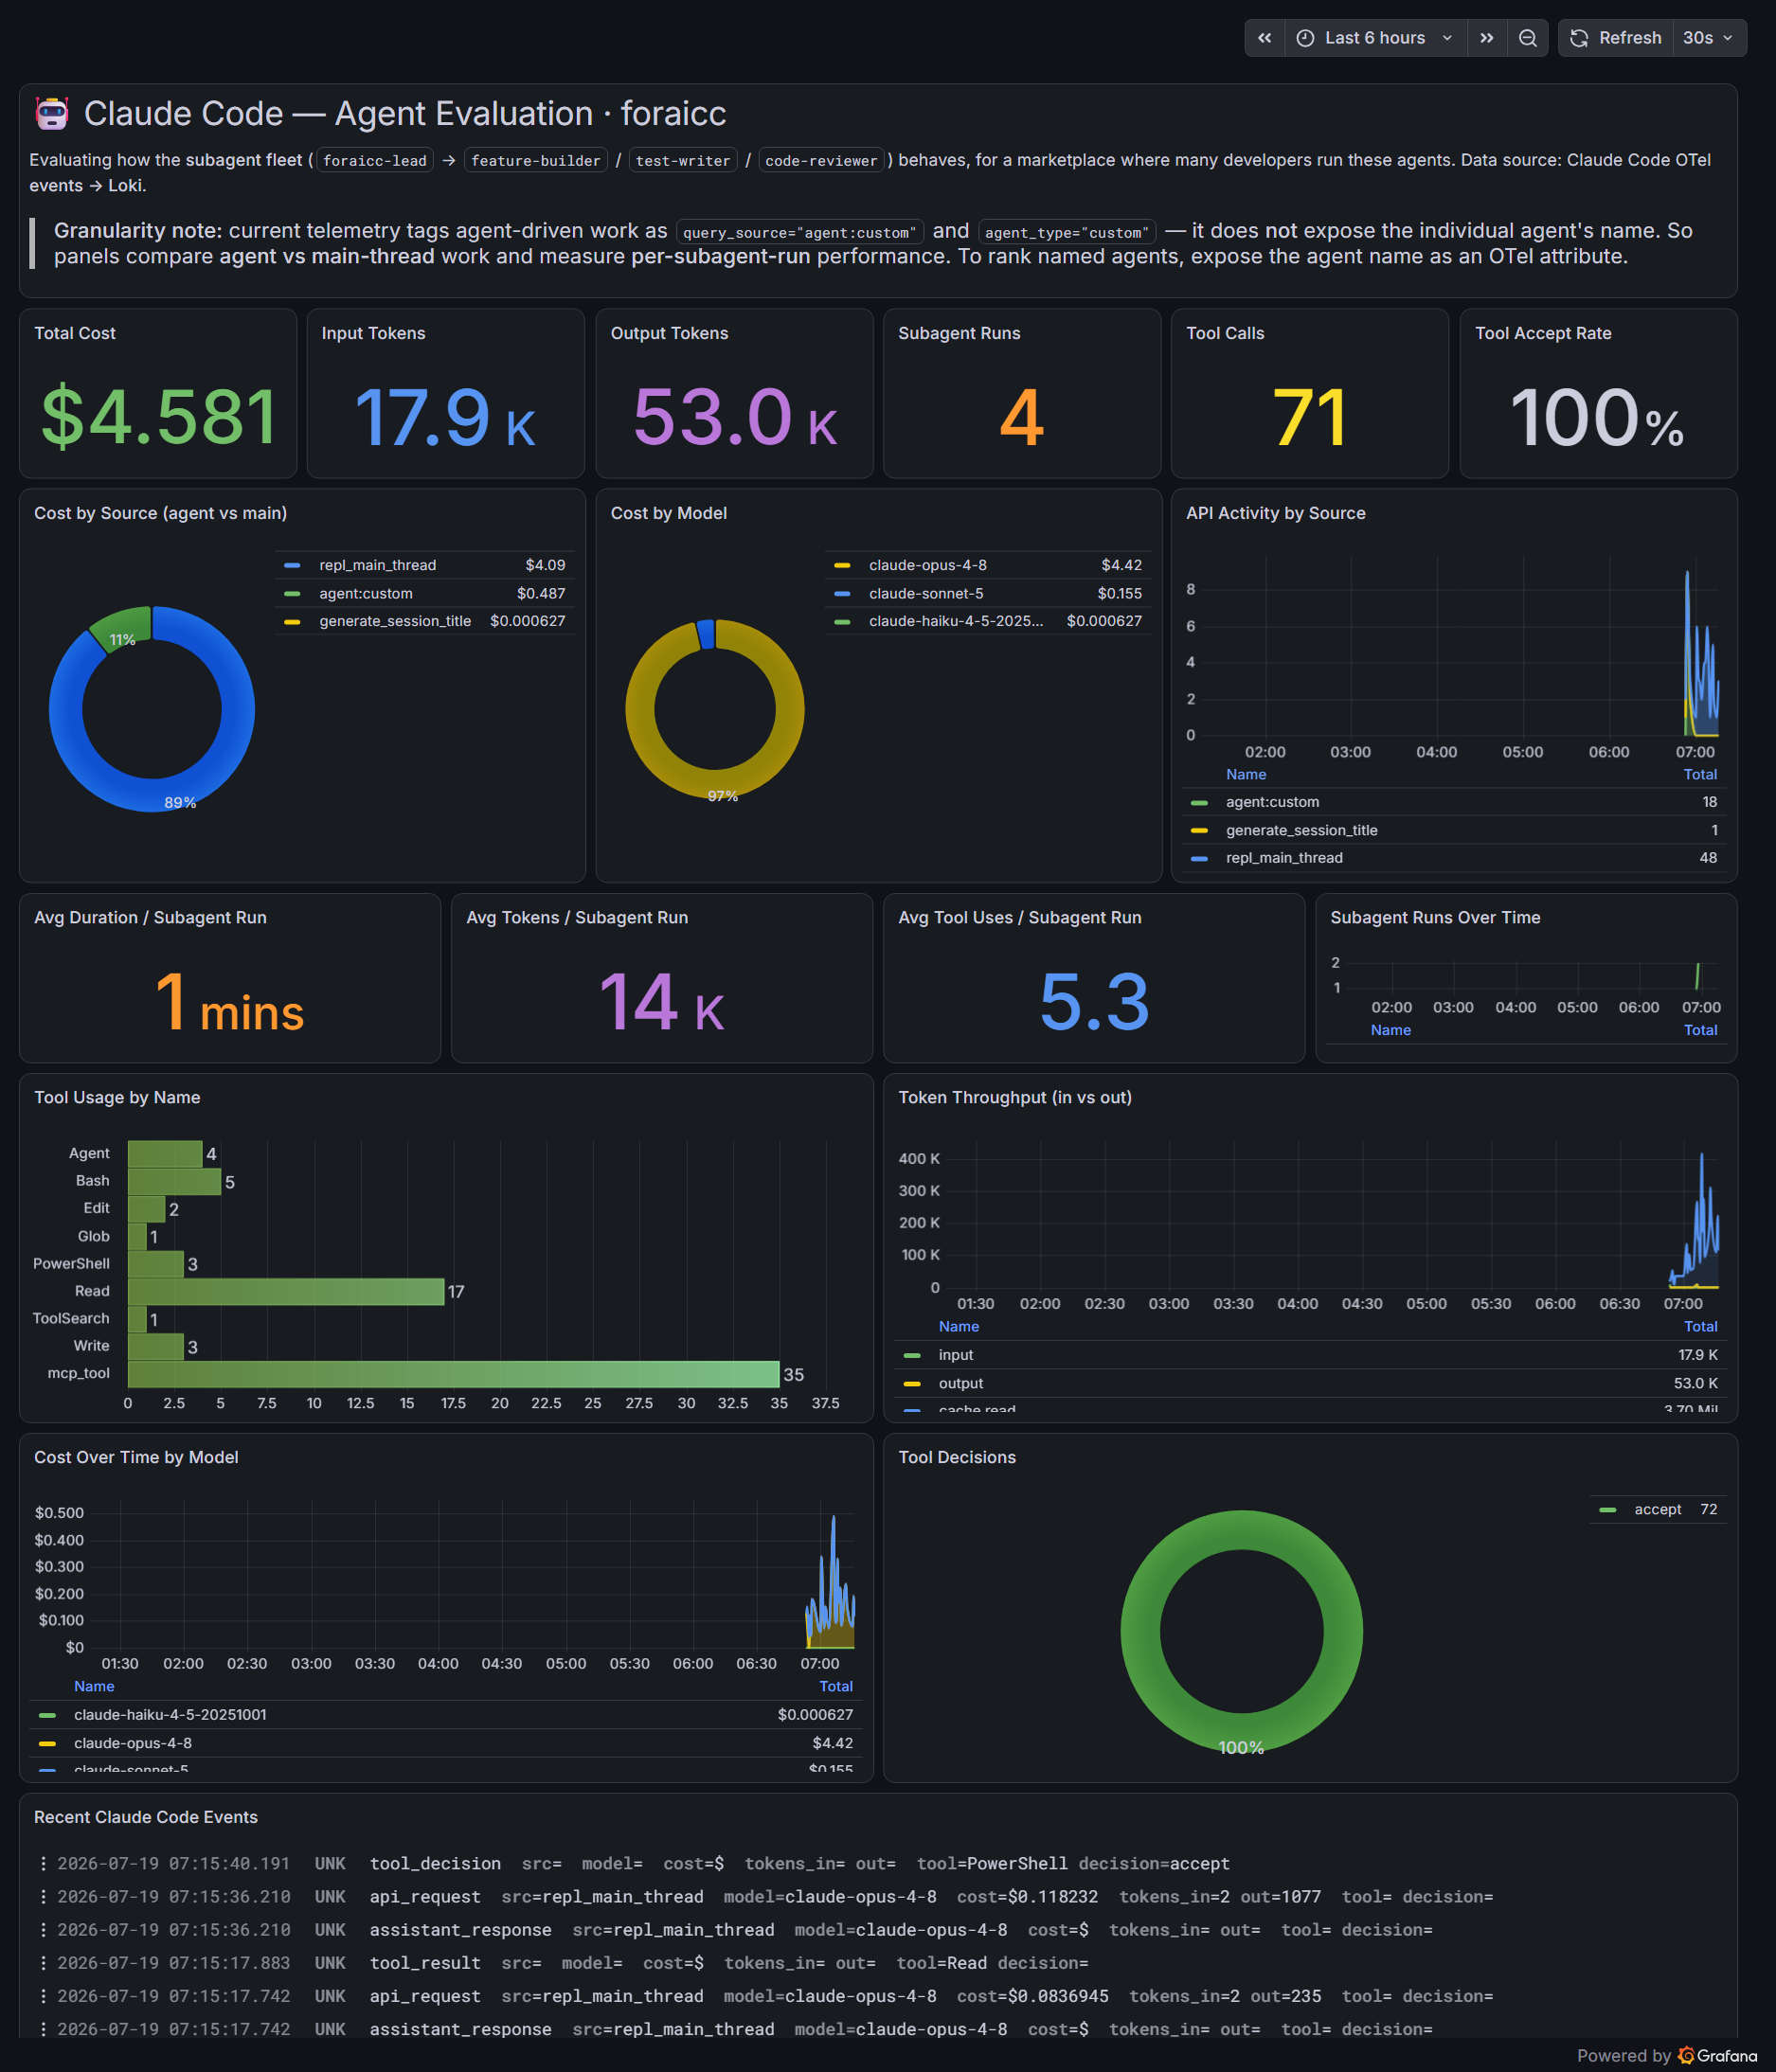
Of ~$4.58 of spend, the sub-agents accounted for only ~11% (agent:custom); the rest was main-thread orchestration. And ~96% of all cost sat on one model (Opus), with Sonnet a rounding error and Haiku effectively free. If you are distributing an agent, that split is the single most actionable chart you own: it tells you whether your cost is in the agents or the orchestration, and whether a cheaper model would move the needle or just add risk for no saving.
Per-run efficiency
The subagent_completed panels give you an efficiency profile: on average each sub-agent run took about a minute, spent ~14K tokens and made ~5.3 tool calls. Those are the numbers you watch over time. If “tokens per run” drifts up after a prompt change, your agent got chattier — and every developer running it just got more expensive.
Behaviour, via tool decisions
The tool-decision panel showed a 100% accept rate across 70-odd tool calls. In a distributed setting, a falling accept rate is an early-warning siren: it usually means the agent is proposing edits or commands that users (or guardrails) are rejecting — a quality regression you would otherwise only hear about through complaints. And the tool-usage bar chart (heavy on mcp_tool and Read) tells you what the agent actually does with its time.
Zooming in by developer
Everything above treats the fleet as one blob. But a marketplace is not one blob — it is many developers, each running your agents on their own machine, each spending against their own budget. The useful surprise is that Claude Code stamps every event with the developer identity: user_email, user_account_uuid and user_id ride along on every api_request, tool_result and subagent_completed. That is the dimension that turns an aggregate dashboard into a per-developer one — and for a marketplace it is arguably the most important view you own.
Two additions make it real. First, a developer leaderboard: a table keyed by user_email with spend, output tokens, request count and sub-agent runs, sorted by cost, so the biggest consumers surface themselves. Second, a global filter at the top of the dashboard — type an email (or any regex) into a text box and every panel re-scopes to that one developer. Under the default .* you see the whole population; type alice@ and you are looking at exactly one person's cost curve, model split and tool behaviour.
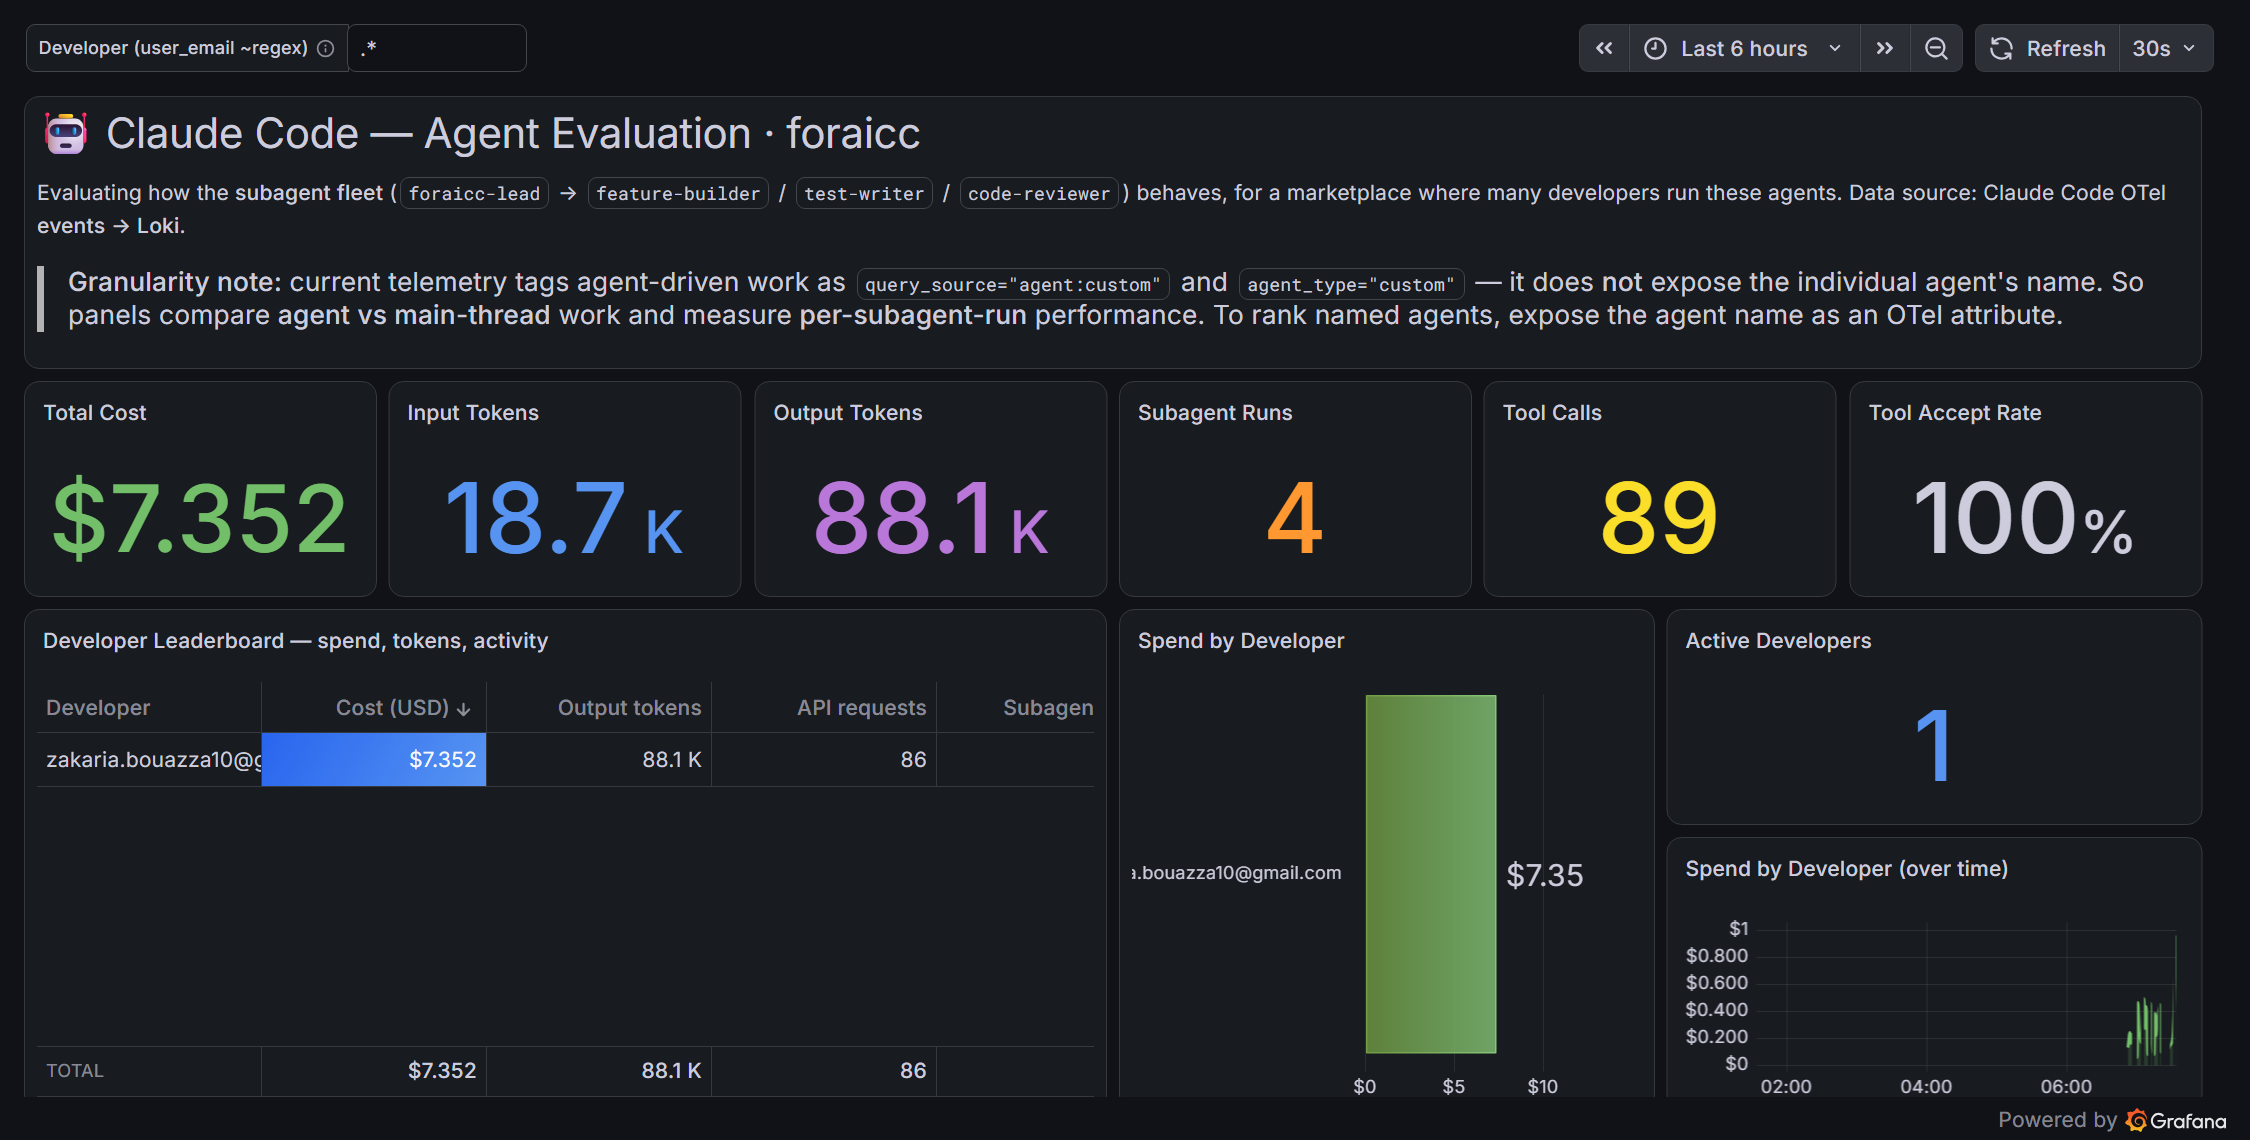
user_email plus a global developer filter. One row today because it is a demo — but this is the exact shape a fleet of real developers produces, one ranked row each.The LogQL is the same shape as before, just grouped by the identity: sum by (user_email) (sum_over_time({service_name="claude-code"} | event_name=`api_request` | unwrap cost_usd [$__range])). Two gotchas earned in the build are worth passing on. To assemble the leaderboard from four separate queries (cost, tokens, requests, runs) I used a join-by-field transform on user_email, not a merge — merge collapses the four identically-named Value columns into one, whereas an outer join keeps them distinct so each becomes its own column. And the global filter uses user_email=~"$user" with an all value of .* rather than .+, because .* matches the empty string and therefore never silently drops an event that happens to lack the field.
One caveat, stated plainly: user_email is real personal data. On a local, operator-run board that is fine. The moment this becomes a shared or multi-tenant view, hash the identity or gate the dashboard — a spend leaderboard with everyone's address in clear is exactly the kind of thing a security review should catch before it ships.
A playbook for distributing an agent with its meter attached
Pulling it together, here is what I would tell an AI engineer about to push an agent to many developers:
- Ship the telemetry env with the agent. Put the
OTEL_*block in projectsettings.jsonand setOTEL_RESOURCE_ATTRIBUTESso each agent/tenant is separable in one backend. Remember env changes need a Claude Code restart to take effect. - Build off events, not just metrics. The Loki event stream gives you per-run granularity that pre-aggregated counters throw away — and it populates immediately.
- Watch three things, not thirty: cost split by source and model (spend ownership), tokens-per-run (efficiency drift), and tool accept rate (behavioural health). Everything else is supporting detail.
- Alert on the derivatives. A cost total is vanity; cost-per-run trending up, or accept rate trending down, is the signal. Wire Grafana alerts to those slopes.
- If you need named-agent rollups, add a hook. The base telemetry stops at
agent:custom; aSubagentStophook that stamps the agent name closes the gap. - Publish the granularity caveats on the dashboard itself. A chart that is honest about what it cannot attribute is worth more than a prettier one that quietly misleads.
What I would add next
Three things are on my list. First, the naming hook, to turn “agent vs main-thread” into a proper per-agent leaderboard. Second, Grafana alerts on cost-per-run and accept-rate slopes, so the dashboard pages me instead of me watching it. Third, wiring Tempo traces in — the events already carry trace_id and span_id, so a full orchestrator-to-sub-agent call tree is one datasource link away.
The broader point is simple, and it is the same one from the banking world: the moment something runs on other people's behalf, its cost and behaviour become an operational surface, not a footnote. Claude Code makes that surface cheap to expose — a handful of environment variables and a single-container LGTM stack. The rest is just deciding to look.
Try it yourself. The whole demo — the FastAPI service, the four agent definitions, the docker compose LGTM stack and the exact Grafana dashboard shown here (exported as JSON) — is on GitHub: zakariahere/claude-code-otel-demo. Bring up the stack, hand the agents the PATCH task, and watch your own cost, tokens and per-developer numbers land in real time.