Putting the LGTM stack on my own box: one container, a Java agent and an owner-only Grafana
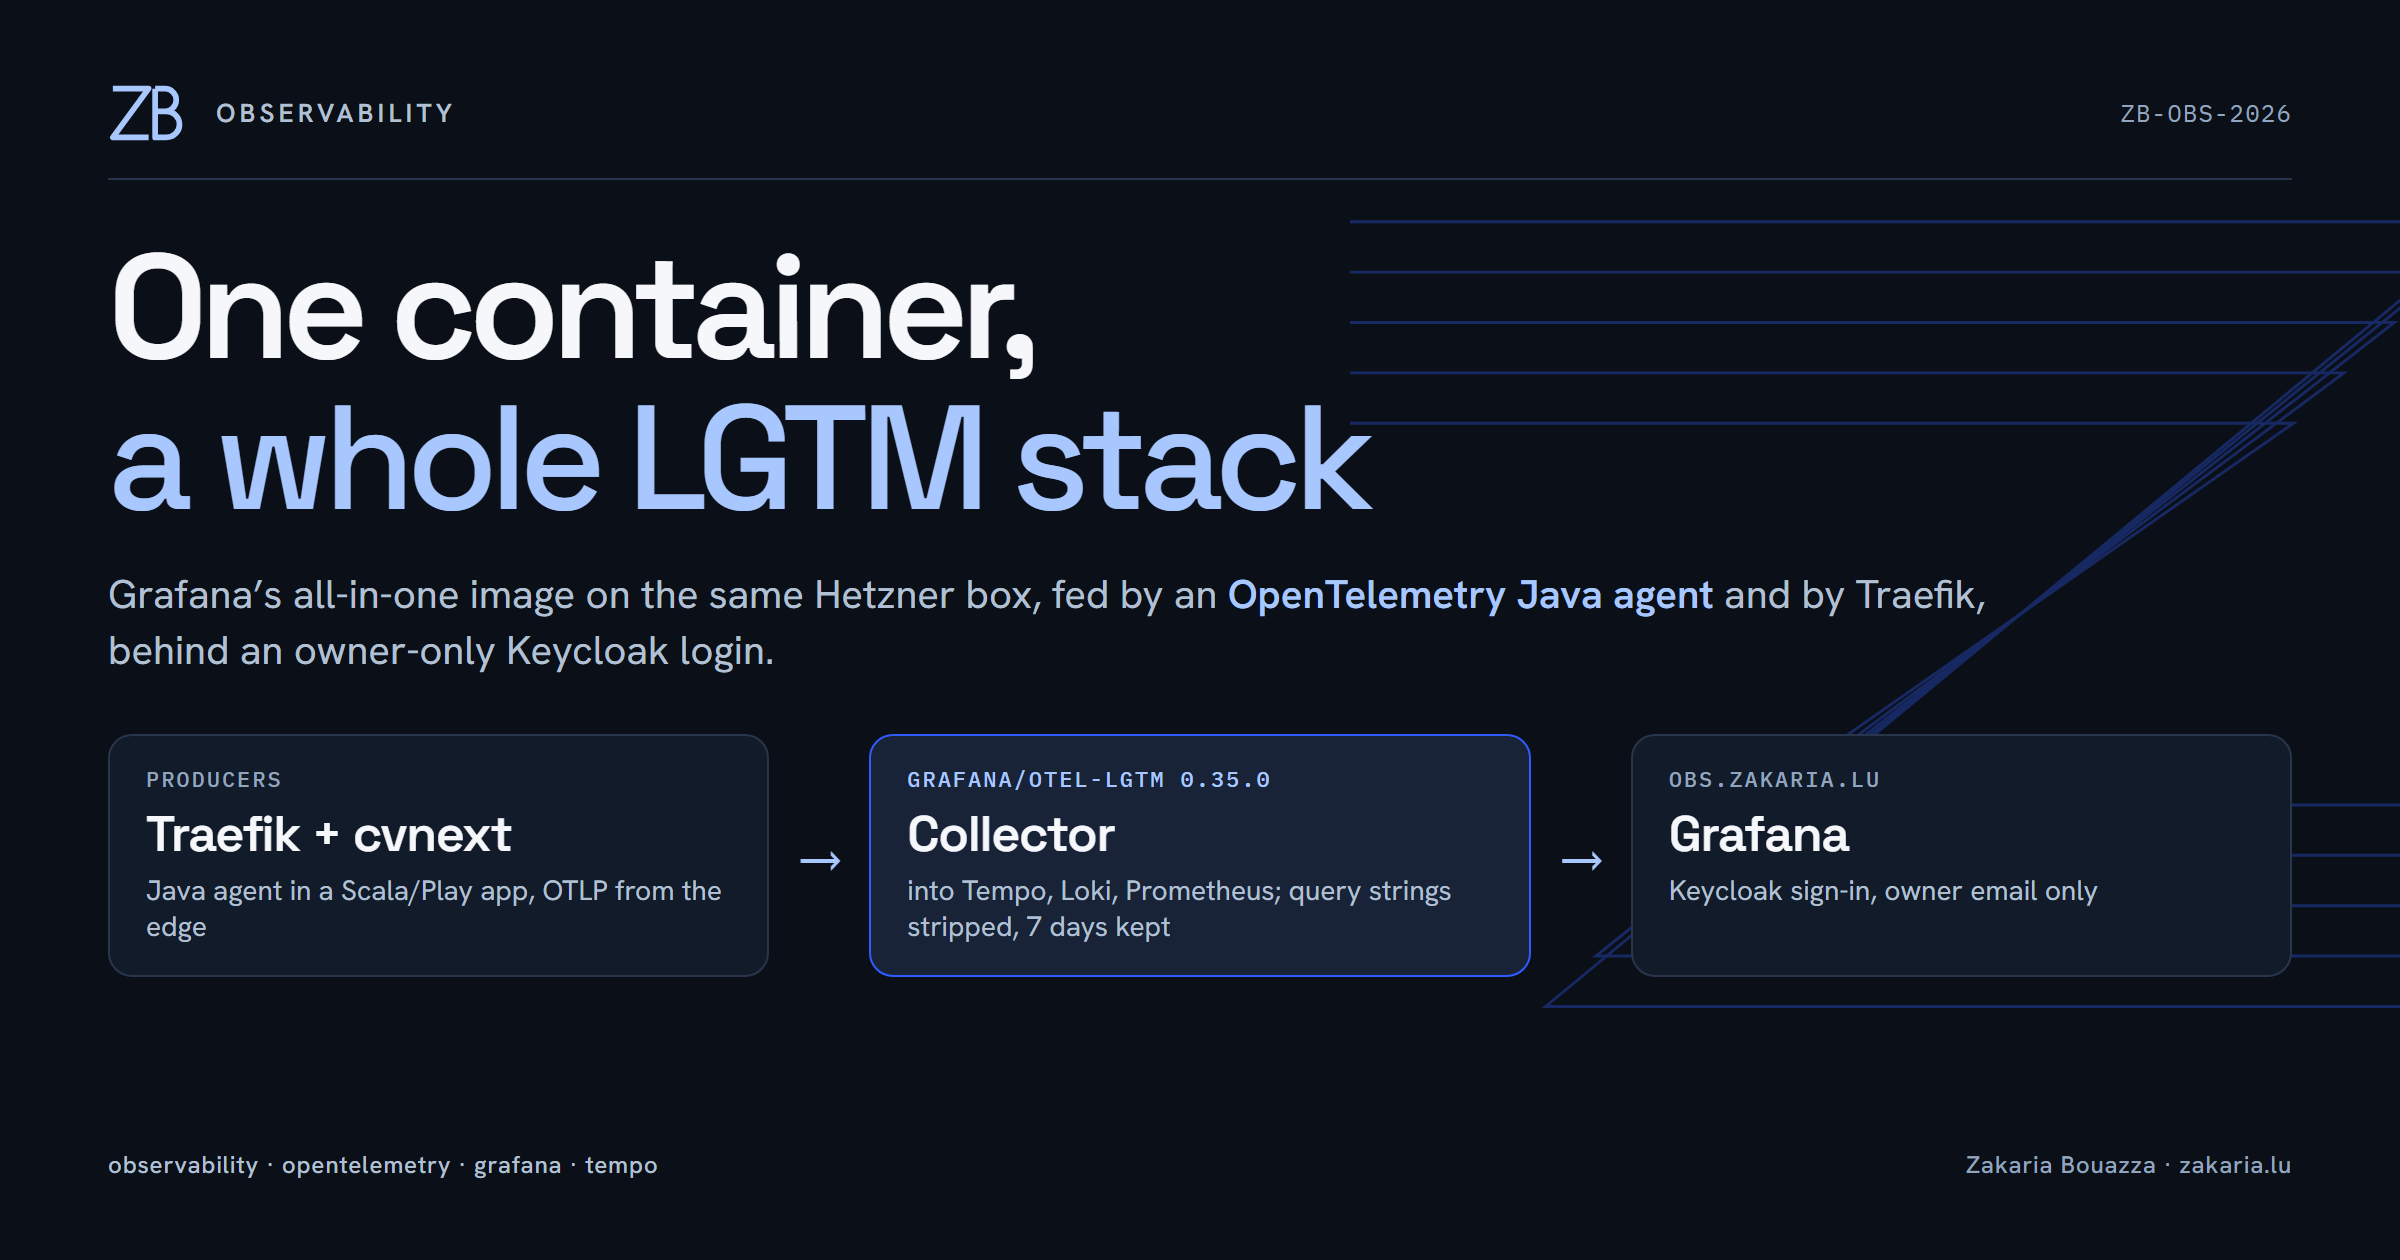
I recently gave the Hetzner box that runs this site more memory: it now has 4 vCPUs and 7.6 GiB, and before this change only about 2 GiB of that was in use. The first thing I wanted to do with the headroom was stop guessing. Until this week the Scala/Play backend had no tracing, no metrics and no health endpoint, only plain stdout logs. This post covers how I added a complete LGTM stack next to the app (Loki, Grafana and Tempo, with Prometheus standing in for Mimir), what it showed me on day one, and the guardrails it needed first.
One container, not five
Grafana publishes grafana/otel-lgtm, a single image that bundles an OpenTelemetry Collector, Prometheus, Tempo, Loki and Grafana. Upstream describes it as a development and demo image. For one owner, one box and a week of data, that trade-off is acceptable to me: there is no HA and no upgrade promise, but there is also only one service to reason about. I pinned 0.35.0, which ships Grafana 13.2, Tempo 3.0, Loki 3.7 and Prometheus 3.15. At rest it uses roughly 840 MiB of its 1.5 GiB limit, and the box still has about 5 GiB free.
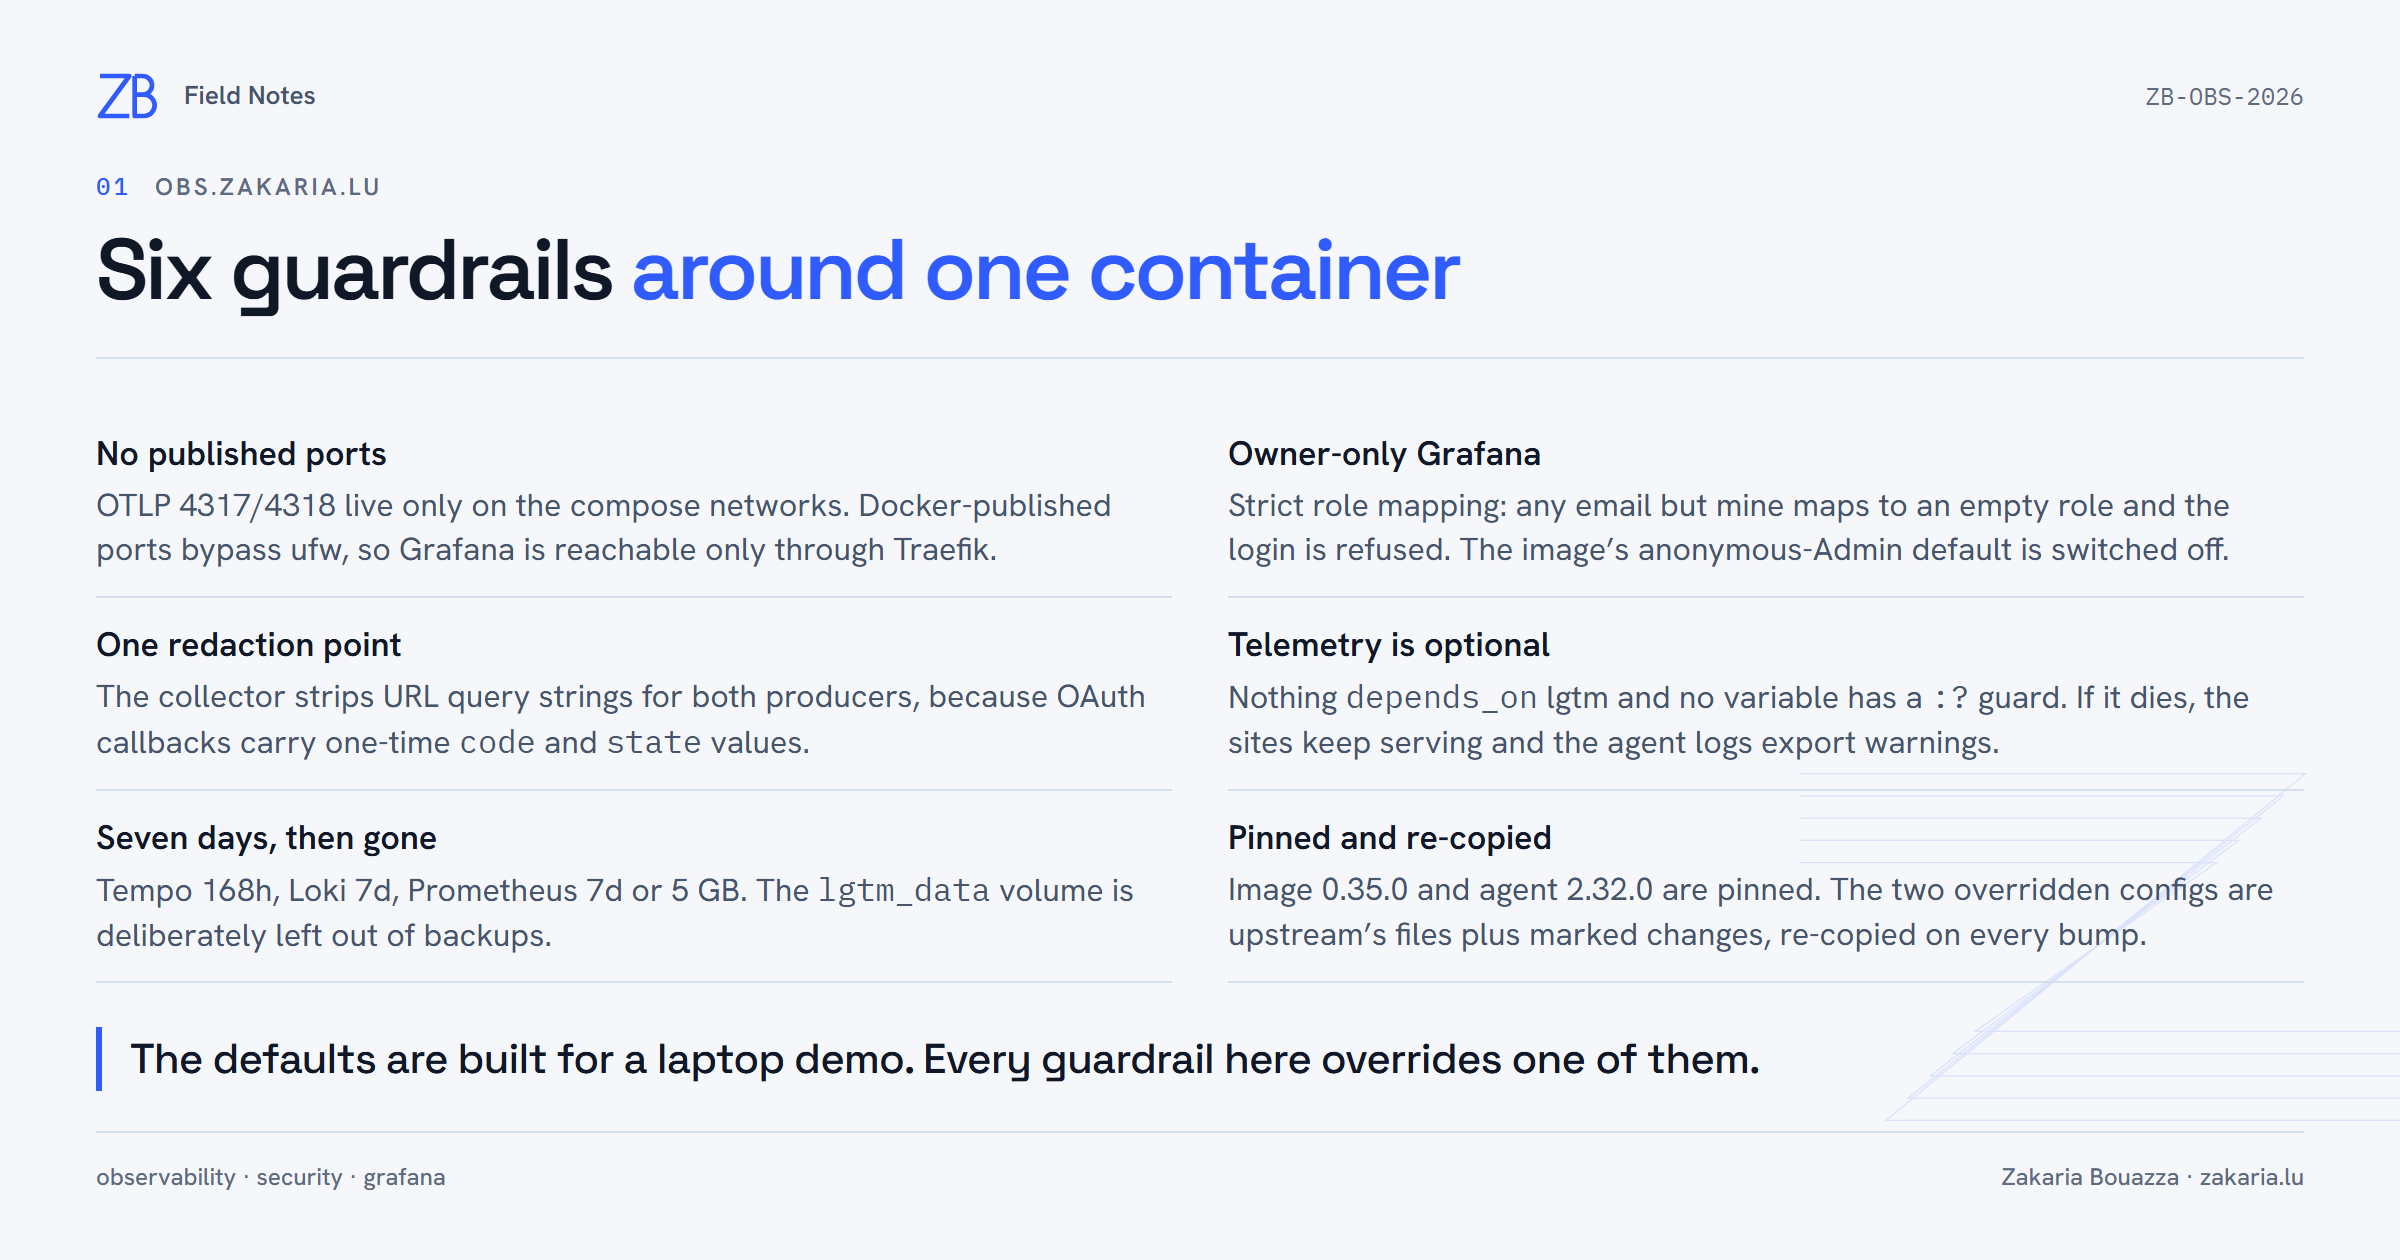
It runs as a Compose service under a profile, on the same internal and proxy networks as the app. It publishes no ports. Docker-published ports go around ufw, so the OTLP receivers on 4317/4318 are reachable only from other containers, and Grafana is reachable only through Traefik on obs.zakaria.lu.
Instrumenting Play without touching Scala
The backend is Scala 2.13 on Play 3, which runs on Pekko HTTP. I used the OpenTelemetry Java agent (2.32.0) instead of an SDK dependency. The agent instruments the HTTP server, JDBC, HikariCP, Play WS, the JDK HTTP client and the JVM runtime. It also forwards logback output as OTLP logs. The jar is baked into the image but inert: Compose switches it on.
cvnext:
  environment:
    JAVA_TOOL_OPTIONS: -javaagent:/app/otel/opentelemetry-javaagent.jar
    OTEL_JAVAAGENT_ENABLED: ${CVNEXT_OTEL_ENABLED:-true}   # kill switch in .env
    OTEL_SERVICE_NAME: cvnext
    OTEL_EXPORTER_OTLP_ENDPOINT: http://lgtm:4318
    OTEL_EXPORTER_OTLP_PROTOCOL: http/protobuf
Keeping it out of the build had a side benefit: the test suites never load the agent, so nothing registers a global OpenTelemetry instance twice in one JVM. Review caught one real bug before it shipped. ADD --chmod=0644 also applied that mode to the directory Docker created for the jar. The app runs as uid 1001, which then could not traverse /app/otel, and -javaagent makes the JVM refuse to start. Creating the directory first with mkdir -m 0755 fixed it.
Traefik needed only flags: --tracing.otlp and --metrics.otlp pointed at http://lgtm:4318. Traefik propagates traceparent, so one trace covers the edge and the application.
Signing in to Grafana through Keycloak
Keycloak already brokers LinkedIn sign-in for the site, so Grafana got its own confidential client with PKCE. As in the backend, the authorize URL is public and the token and userinfo URLs are internal (http://keycloak:8080), with no discovery at startup.
The subtle part is authorization. The realm accepts any LinkedIn account, so signing in proves very little. Grafana’s strict role mapping does the actual gating:
GF_AUTH_GENERIC_OAUTH_ROLE_ATTRIBUTE_PATH: "email == '${GRAFANA_OWNER_EMAIL}' && 'GrafanaAdmin' || ''"
GF_AUTH_GENERIC_OAUTH_ROLE_ATTRIBUTE_STRICT: "true"
GF_AUTH_ANONYMOUS_ENABLED: "false"
My first draft returned 'None' for everyone else. That is a mistake, because None is a valid Grafana role, so a stranger would have got an account with no permissions instead of a refusal. An empty string fails strict mapping, and the login is rejected. The anonymous setting matters just as much: the image starts Grafana with anonymous Admin enabled, which is fine on a laptop and not on a public hostname.
Redaction and retention
OAuth callbacks carry one-time code and state values in the query string, and both producers record URLs. Rather than configure each producer, I added a transform processor to the collector’s trace and log pipelines. It deletes url.query and cuts everything after ? from url.full, http.url and http.target. After rollout, a TraceQL search for spans with a query string returned zero.
Retention is seven days everywhere: Prometheus via --storage.tsdb.retention.time=7d plus a 5 GB cap, Loki via its compactor, and Tempo via its config. Tempo 3 removed the top-level compactor block, and the startup error says only field compactor not found. Retention now sits under backend_scheduler and backend_worker. I checked the effective value through /status/config instead of trusting the file. The data volume is deliberately excluded from backups.
Telemetry is also optional. Nothing depends_on the lgtm service, and none of its variables use Compose’s :? guard. If it stops, the four public sites keep serving, and the agent only logs export warnings.
What it showed on day one
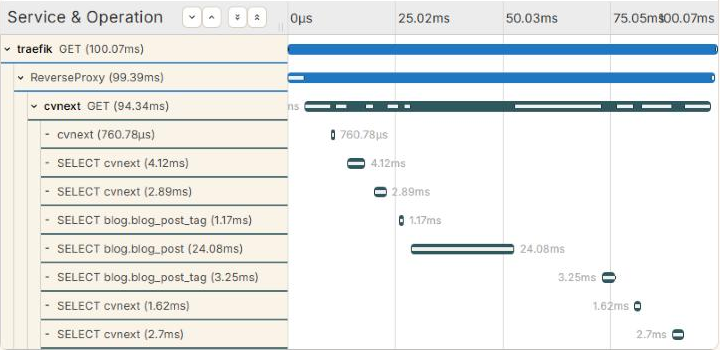
This is a request for a blog tag page. Traefik hands it to cvnext, and the app runs six SQL statements; the 24 ms SELECT blog.blog_post is most of the 100 ms.
The service graph came from Tempo’s metrics generator without any extra work. It also raised two questions I had to answer before trusting it.
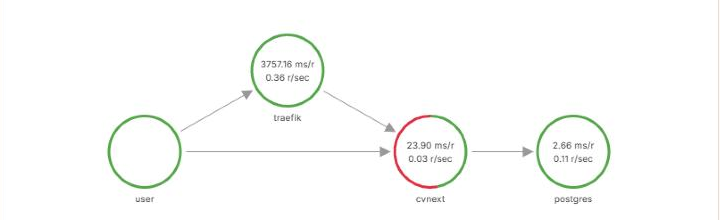
- Traefik averaging 3.7 seconds per request. Every slow Traefik span I sampled was a long-lived connection, mostly Grafana’s own
/api/live/wswebsocket, plus MCP streaming sessions. A websocket span lasts as long as the tab stays open. - The red segment on cvnext. A search for cvnext spans with
status=errorreturned nothing. The failures come from Traefik’s client spans, which mark 4xx responses (401s, 400s, 404s) as errors. Server spans mark only 5xx as errors.
Traefik’s router metrics told the most honest story. The busiest router on the box this morning was Grafana itself:
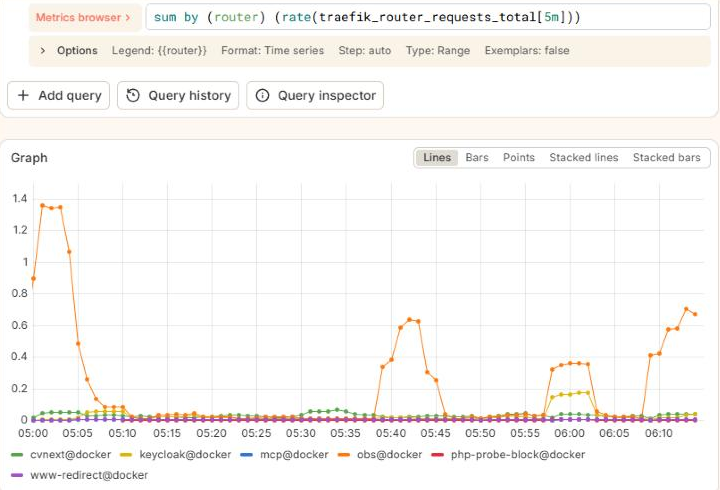
Logs are the weakest signal so far. Loki receives cvnext’s logs, but a quiet morning produced only the startup lines. The log pattern now includes trace_id=%X{trace_id}, so a line from docker compose logs can be pasted straight into Tempo once there is something to correlate.
The gap the dashboards exposed
Tempo’s span-metrics table grouped every request under its HTTP method:
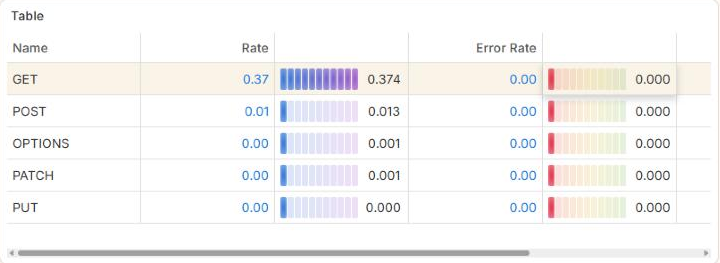
http.route, every Play request is just GET or POST.The agent instruments Pekko HTTP, but on Play 3 it does not set http.route. That leaves span names and RED metrics too coarse to compare /api/me with a blog page. A small follow-up shipped the same morning: a Play filter that copies the matched route pattern onto the current server span, using only the instrumentation API. New traces now carry routes such as /blog, /case-study and /api/me. Requests served through the host-routing catch-all still share /{*path}, so that is the next refinement.
Notes from the rollout
CD ships only the image. The Compose file, the two bind-mounted configs, the Keycloak client, .env and DNS were all manual steps on the box. I did them with Claude Code over SSH, and generated the Grafana client secret on the box so it never left the box. One thing I relearned: the box uses ufw limit on SSH, so more than six connections in 30 seconds from one IP get dropped. A drift-sync script that opened a new connection per step tripped it halfway through. The sites were never affected, but I now batch remote checks into one connection.
The result is a week of traces, metrics and logs for the cost of under 1 GiB of RAM, visible only to me, and one more domain I can switch off with a single variable.