Embabel Agents Being Tracked Through LGTM Observability
An agent framework that plans its own execution has an obvious problem: when something goes wrong, you didn't write the control flow, so you can't read it back off the page. Embabel answers that with logs, which are charming (it ships Star Wars, Monty Python and Severance themed loggers) but ephemeral. What I actually wanted was the thing I'd expect from any production JVM service: distributed traces.
So I pointed my agent project at a local Grafana LGTM stack — Loki, Grafana, Tempo, Mimir in a single container — and got exactly nothing. Empty dashboards. This is the full walkthrough of getting from nothing to a complete span tree, including the three gotchas that cost me the most time.
The setup
The stack is the grafana/otel-lgtm image running as a container called lgtm-1, publishing Grafana on 3000 and the OTLP receivers on 4317 (gRPC) and 4318 (HTTP). The app is an ordinary Spring Boot 3.5.13 project on Embabel 0.3.5, running on the host via mvnw spring-boot:run.
Embabel ships an observability starter, so step one is trivial:
<dependency>
    <groupId>com.embabel.agent</groupId>
    <artifactId>embabel-agent-starter-observability</artifactId>
    <version>${embabel-agent.version}</version>
</dependency>
And the configuration, in application.properties:
spring.application.name=myfirstagent

embabel.agent.infrastructure.observability.enabled=true
embabel.agent.infrastructure.observability.tracing.enabled=true
embabel.agent.infrastructure.observability.tracing.sampling-probability=1.0

management.tracing.enabled=true
management.tracing.sampling.probability=1.0

management.otlp.tracing.endpoint=http://localhost:4317
management.otlp.tracing.transport=grpc
management.otlp.metrics.export.url=http://localhost:4318/v1/metrics
That final block is where all three gotchas live.
Gotcha 1: the starter ships no exporters
This is the one that produced the empty dashboard. The observability starter brings in the OpenTelemetry SDK, Spring Boot Actuator, and the Micrometer tracing bridge. It does not bring the OTLP exporters. I checked the resolved tree rather than guessing:
io.opentelemetry:opentelemetry-sdk-trace       present
io.micrometer:micrometer-tracing-bridge-otel   present
io.opentelemetry:opentelemetry-exporter-otlp   MISSING
io.micrometer:micrometer-registry-otlp         MISSING
Spring Boot's OtlpTracingAutoConfiguration is conditional on the exporter classes being on the classpath. Without them the whole management.otlp.* block is silently inert — no warning, no error, just nothing leaving the process. The tell is one line in the startup log:
SdkTracerProvider configured with 1 processor(s) and 0 exporter(s)Zero exporters. Adding the two dependencies (both version-managed by the Spring Boot parent, so no explicit version) flipped it to 1 exporter(s) and data started flowing:
<dependency>
    <groupId>io.opentelemetry</groupId>
    <artifactId>opentelemetry-exporter-otlp</artifactId>
</dependency>
<dependency>
    <groupId>io.micrometer</groupId>
    <artifactId>micrometer-registry-otlp</artifactId>
</dependency>
Gotcha 2: 4317 is gRPC, Spring Boot defaults to HTTP
Port 4317 is the OTLP gRPC receiver; 4318 is OTLP/HTTP. Spring Boot's management.otlp.tracing.transport defaults to http. Point HTTP at 4317 and it fails. Two valid fixes: keep 4317 and add transport=grpc (what I did), or use endpoint=http://localhost:4318/v1/traces and leave the transport alone. Note the metrics registry is HTTP-only, which is why the metrics URL points at 4318 while traces go to 4317 — an inconsistency that looks like a typo but isn't.
Gotcha 3: localhost, not the container name
My first draft used http://lgtm-1:4317, the container name. That only resolves through Docker's embedded DNS, which works between containers on the same network. My Spring app is a host process, so it reaches the stack through the published port mappings on localhost. The container name would only be right if I containerised the agent and put it on the same network.
Proving it before opening the UI
Rather than hunt through Grafana, I asked Tempo directly which services it had seen. Tempo's own API isn't published in this image, but you can proxy through Grafana:
curl "http://localhost:3000/api/datasources/proxy/uid/tempo/api/v2/search/tag/resource.service.name/values"
# -> embabel-agent
Which immediately explained the other half of "I see nothing": the traces are tagged service.name=embabel-agent, set by Embabel's own autoconfiguration — not myfirstagent from spring.application.name. Metrics, meanwhile, do go out as myfirstagent, because those come from the Micrometer registry. So the two signals land under different service names. Worth knowing before you build a dashboard and try to join them on the wrong label.
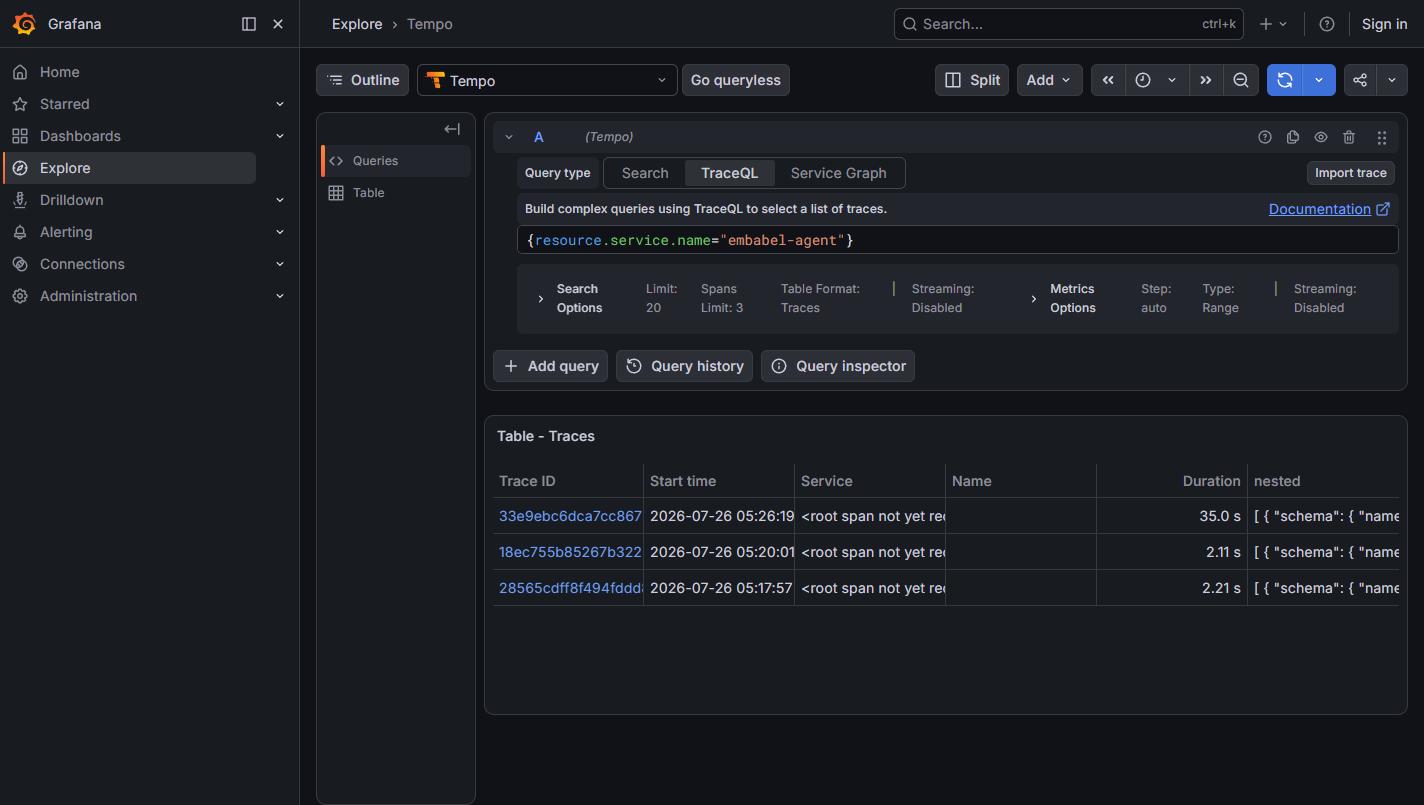
{resource.service.name="embabel-agent"}. Three agent runs — two triage runs and one longer write-review-translate pipeline.What a branching agent looks like
Here's the support-triage agent from an earlier post — an LLM classifies a ticket, then Embabel routes into one of three @State branches. The span tree reads exactly like the mental model:
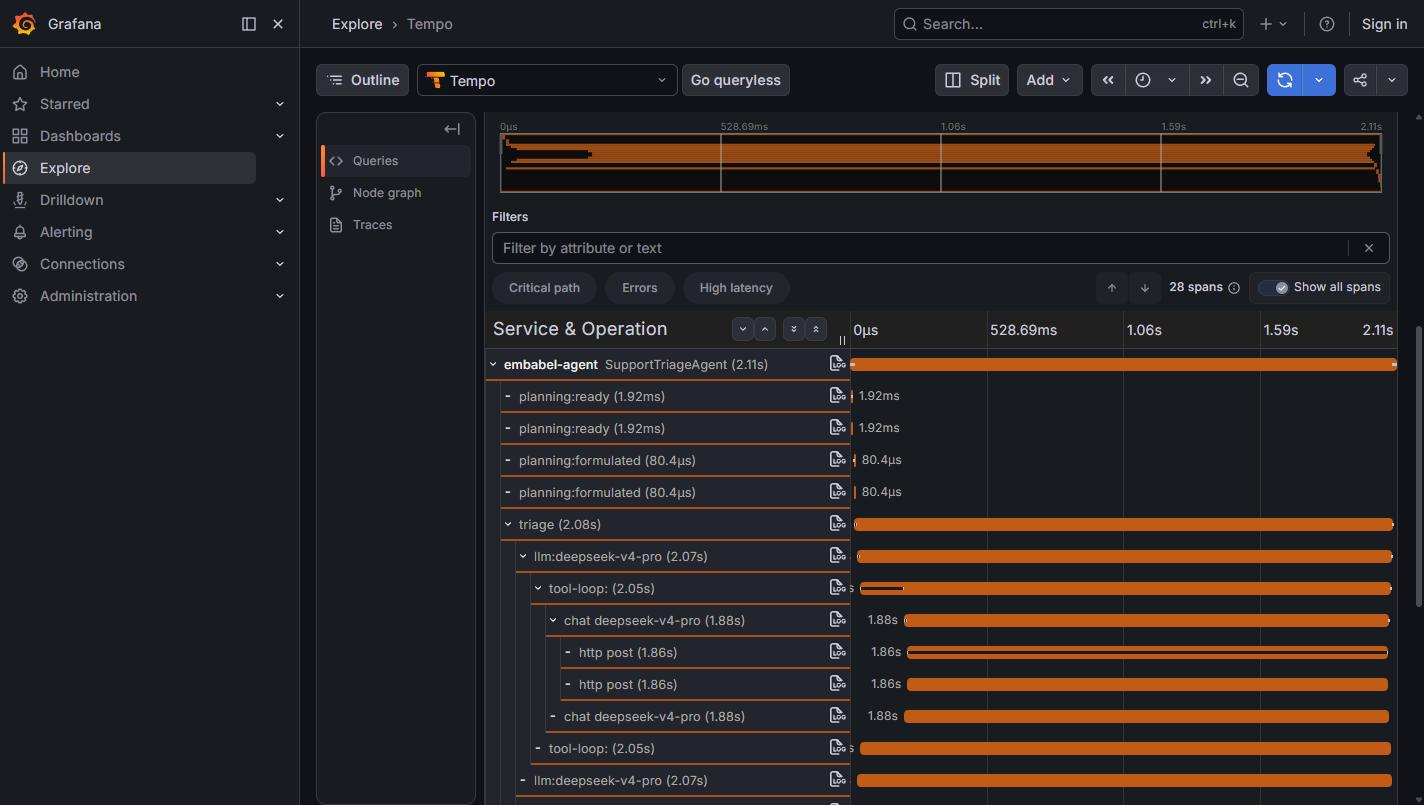
planning:ready observes world state, planning:formulated commits to a plan. Then the triage action nests llm:deepseek-v4-pro → tool-loop → chat → http post.Scroll down and you see the branch resolve. This is the bit I find genuinely delightful — the state transition and the re-plan are both spans:
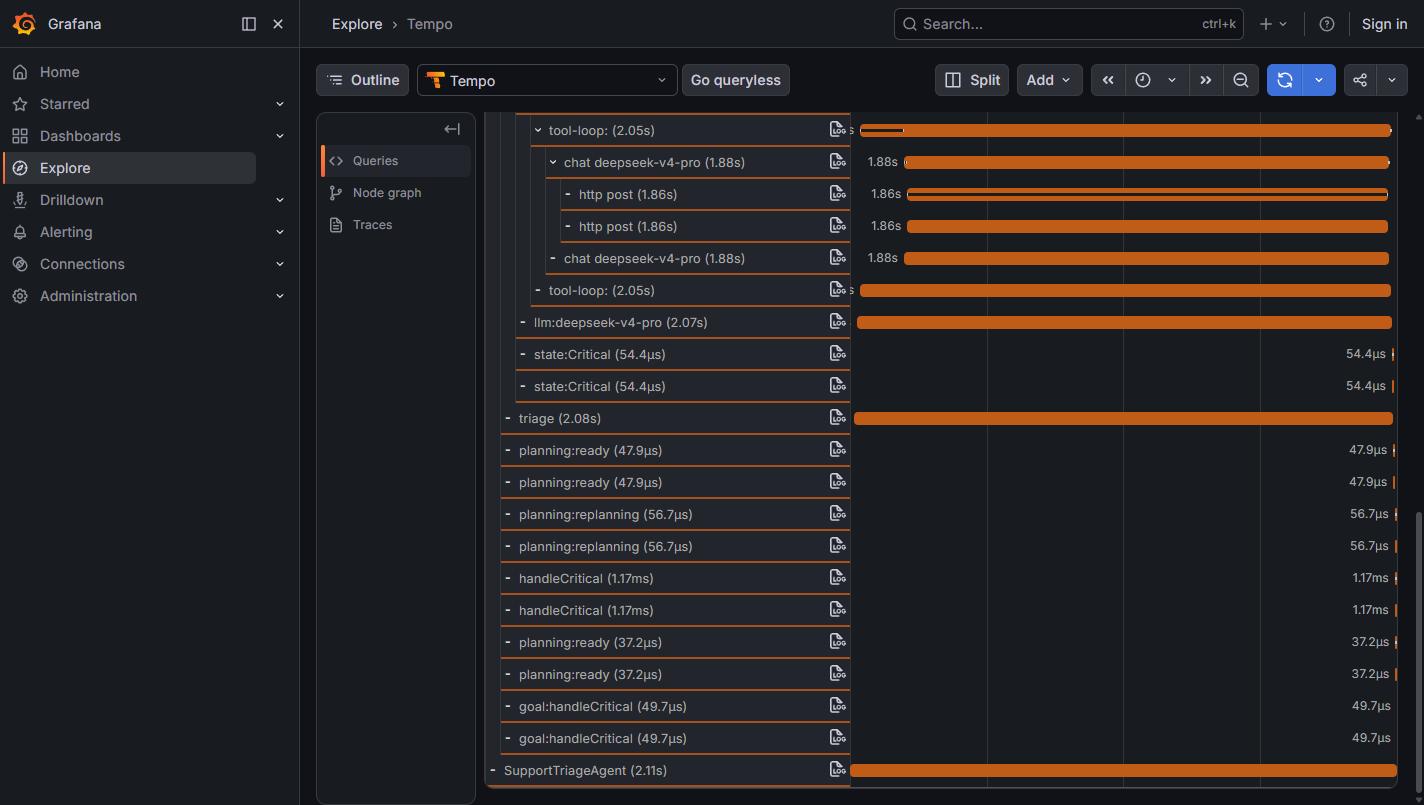
state:Critical (54µs) is the classifier's routing decision. Then planning:replanning, the handleCritical branch handler, and finally goal:handleCritical. The two branches that weren't taken never appear — state scoping, visible.What a linear pipeline looks like
The other agent is a three-step GOAP pipeline: write a story, review it, translate it. 44 spans, 35 seconds, and you can read the entire plan off the waterfall:
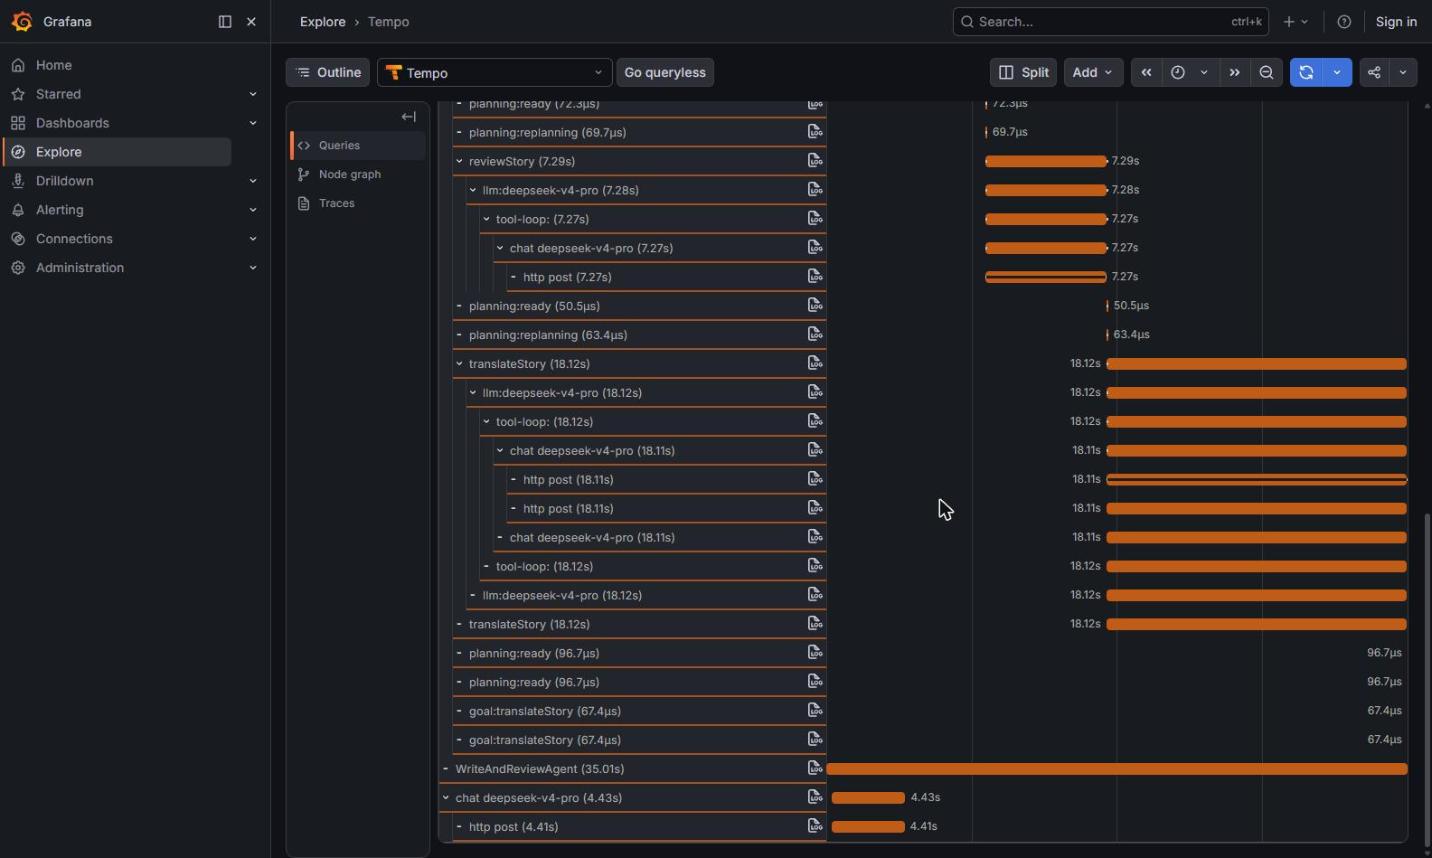
reviewStory (7.29s) → planning:replanning → translateStory (18.12s) → goal:translateStory. Note the planner re-plans between every action — that's the OODA loop, not a fixed script.The timings are instantly useful. translateStory took 18.12s of the 35s total — more than craftStory (9.56s) and reviewStory (7.29s) combined. Translation returns the longest completion, so it dominates. I'd never have known which step to optimise from the logs alone; the waterfall makes it obvious at a glance.
What Embabel puts on the spans
Click into an llm: span and the attributes are rich — and pleasingly, they follow the OpenTelemetry gen_ai.* semantic conventions rather than inventing a private schema:
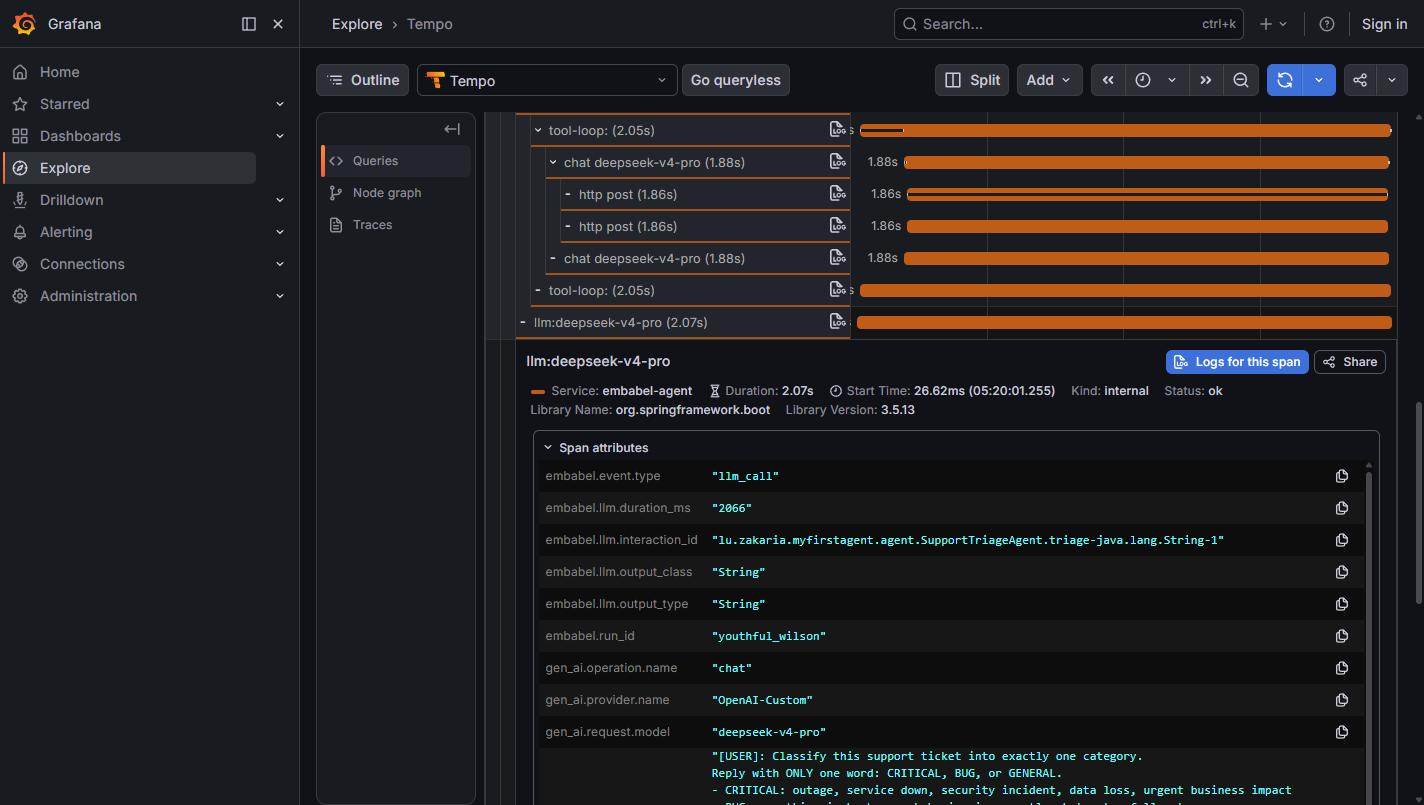
embabel.event.type, embabel.llm.duration_ms, embabel.run_id) and the vendor-neutral gen_ai.* conventions.Two attributes stand out. embabel.llm.interaction_id is lu.zakaria.myfirstagent.agent.SupportTriageAgent.triage-java.lang.String-1 — the fully-qualified action method plus its output type, so you can attribute any LLM call back to the exact line of code that made it. And embabel.run_id is youthful_wilson, the same human-readable run name the shell prints, which means you can pivot from a log line straight to its trace.
The prompt and the answer are in the trace
Scroll further down the attribute list and you find input.value and output.value:
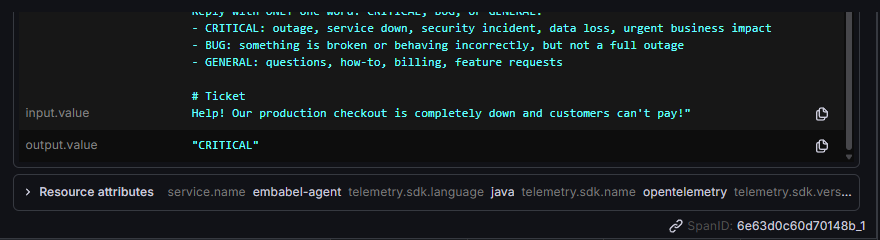
"CRITICAL".For debugging this is superb. Prompt engineering is mostly archaeology, and having the exact rendered prompt attached to the span that used it removes an entire category of guesswork. You can see precisely what the model saw.
For anyone working in a regulated domain, though, sit with that for a second. Whatever the user typed is now in your tracing backend. If that ticket contained an account number, a name, or a card PAN, it has just been copied into Tempo with a retention policy that was probably designed for HTTP latency, not personal data. In banking that's a conversation with your DPO, not a footnote. Before this goes anywhere near production I'd want either a span processor that redacts input.value/output.value, or that capture switched off entirely, with prompts kept in an audited store instead. The feature is excellent; the default is aimed at local development.
One oddity: every span appears twice
Worth reporting honestly, because I haven't fully run it to ground. In every trace, each span is duplicated — the triage run reports 28 spans for 14 logical operations, the pipeline 44 for 22. You can see it in the screenshots above: two planning:ready, two http post, two state:Critical, identical durations. It isn't a rendering artefact; the raw Tempo API returns each name twice within a single trace.
My working theory is double instrumentation — both Embabel's EmbabelTracingObservationHandler and the Micrometer bridge producing a span for the same observation. The startup log shows Embabel deliberately swapping out Spring Boot's default handler and registering a predicate to suppress duplicate tool-call observations, so the seam is clearly a known area. It doesn't break anything (durations and parenting are correct, and it's cosmetic in the waterfall) but it does double your span volume, which matters for retention cost at scale. Something to raise upstream rather than paper over.
Queries worth keeping
Once the data is in, TraceQL makes the agent-specific questions easy:
# every agent run
{resource.service.name="embabel-agent"}

# runs where an LLM call took over five seconds
{resource.service.name="embabel-agent" && name=~"llm:.*" && duration > 5s}

# everything a specific model did
{span.gen_ai.request.model="deepseek-v4-pro"}

# find the trace for a run id you saw in the logs
{span.embabel.run_id="youthful_wilson"}
One operational note: traces flush on shutdown, but the OTLP metrics registry pushes on a one-minute interval. A short-lived spring-boot:run that exits in five seconds will produce traces and no metrics. Keep the shell alive a minute if you want both.
Why this matters more for agents than for services
With a normal Spring service, tracing tells you something you could mostly have reasoned about from the code — controller calls service calls repository. With a planning agent, the execution order is derived at runtime from action signatures and world state. The trace isn't a convenience; it's the only honest record of what the planner actually decided. Every concept from the framework has a span: planning:formulated is the plan, state:Critical is the routing decision, planning:replanning is the OODA loop turning over, goal:translateStory is termination. You are, quite literally, watching the planner think.
Total cost: two missing dependencies, one transport flag, one hostname. For that you get token-level, action-level, plan-level visibility into a system whose whole selling point is that it decides its own control flow. Worth every minute of the yak-shave.