Auto-instrumenting Spring Batch 6 with OpenTelemetry — four silent failures
What I actually wanted
A plain question: can I take a Spring Batch job and see it in Grafana — job, step, chunk, item — without hand-writing a single span? On Spring Boot 4 and Spring Batch 6, exporting to a local Grafana LGTM stack. The answer is yes, but the road there taught me more about Boot 4's plumbing than I bargained for.
Two things people mean by “auto-instrumentation”
The word is overloaded, and the distinction is the whole story:
Agent auto-instrumentation — the OpenTelemetry Java agent (
-javaagent). Truly zero-code, bytecode-woven at startup. It knows JDBC, HTTP, Kafka, Logback — but it has no Spring Batch instrumentation. It will never draw you a step span.Framework-native — Spring Batch itself wraps every
JobExecutionandStepExecutionin a Micrometer Observation. Bridge those observations to OpenTelemetry and you get spans and metrics for free. This is the only path that understands “chunk” and “item”.
So for batch semantics there is no choice: the framework-native path is it. The agent is complementary — it covers the JDBC calls underneath each step, not the step. I went framework-native.
What you get when it works
One run of a trivial five-item, chunk-size-two job produces a full trace: the job at the root, the step beneath it, and read / process / write spans under that. The item.process bars are the tell — each ~50 ms, exactly the Thread.sleep(50) in my processor.
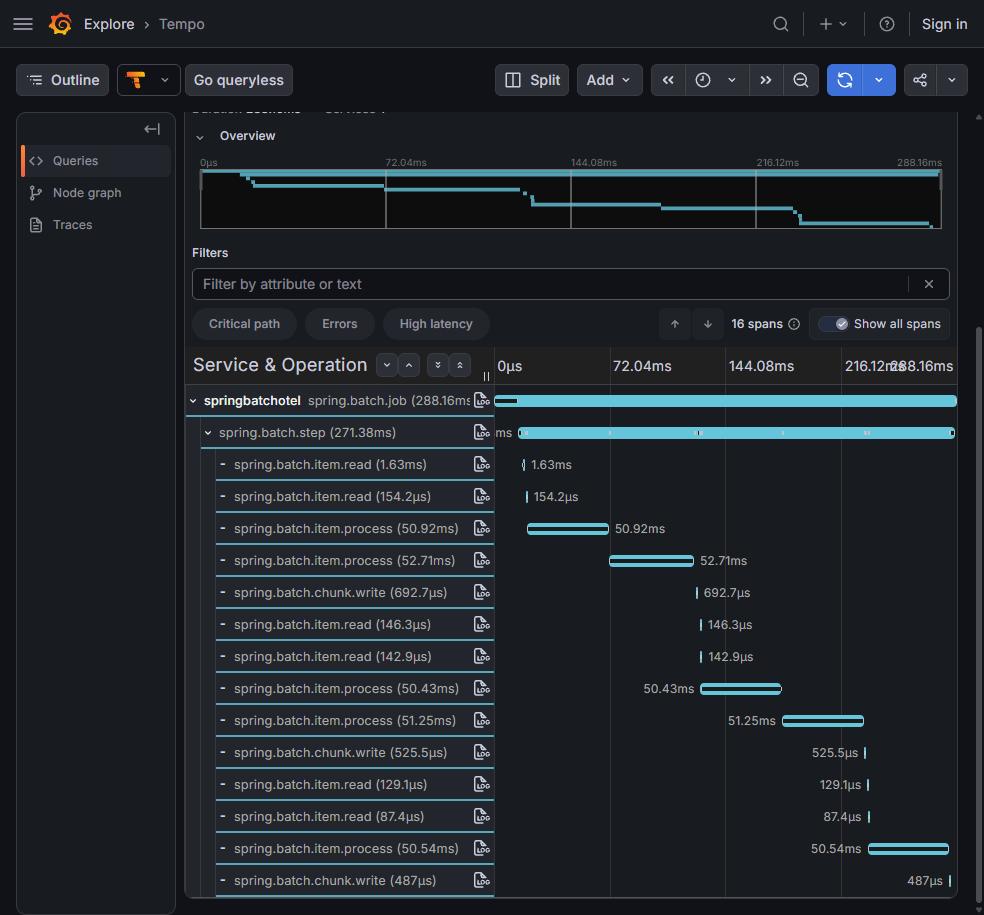
16 spans, zero hand-written. The item.process bars are the 50 ms sleep in the processor.
None of my ItemReader / ItemProcessor / ItemWriter code knows OpenTelemetry exists. That is the point of “auto”.
The dependencies that should have just worked
Spring Initializr's Distributed Tracing option on Boot 4 defaults to Brave, not OpenTelemetry. Swapping in the raw Micrometer OTel bridge is the obvious move — and it is the wrong one. The bridge alone gives you the observation→span translation but none of Boot's autoconfig, so no exporter bean is ever built. The piece that matters is Boot's own module, which transitively pulls spring-boot-opentelemetry:
<dependency>
  <groupId>org.springframework.boot</groupId>
  <artifactId>spring-boot-micrometer-tracing-opentelemetry</artifactId>
</dependency>
<dependency>
  <groupId>io.micrometer</groupId>
  <artifactId>micrometer-tracing-bridge-otel</artifactId>
</dependency>
<dependency>
  <groupId>io.opentelemetry</groupId>
  <artifactId>opentelemetry-exporter-otlp</artifactId>
</dependency>
That module's OpenTelemetryProperties class is the gate for both the OTLP span exporter and the OTLP metrics registry. Miss it and both autoconfigs back off in silence.
Four silent failures
Here is what actually happened. Every one of these failed the same infuriating way: the job ran green, the Maven build succeeded, and nothing landed in Tempo.
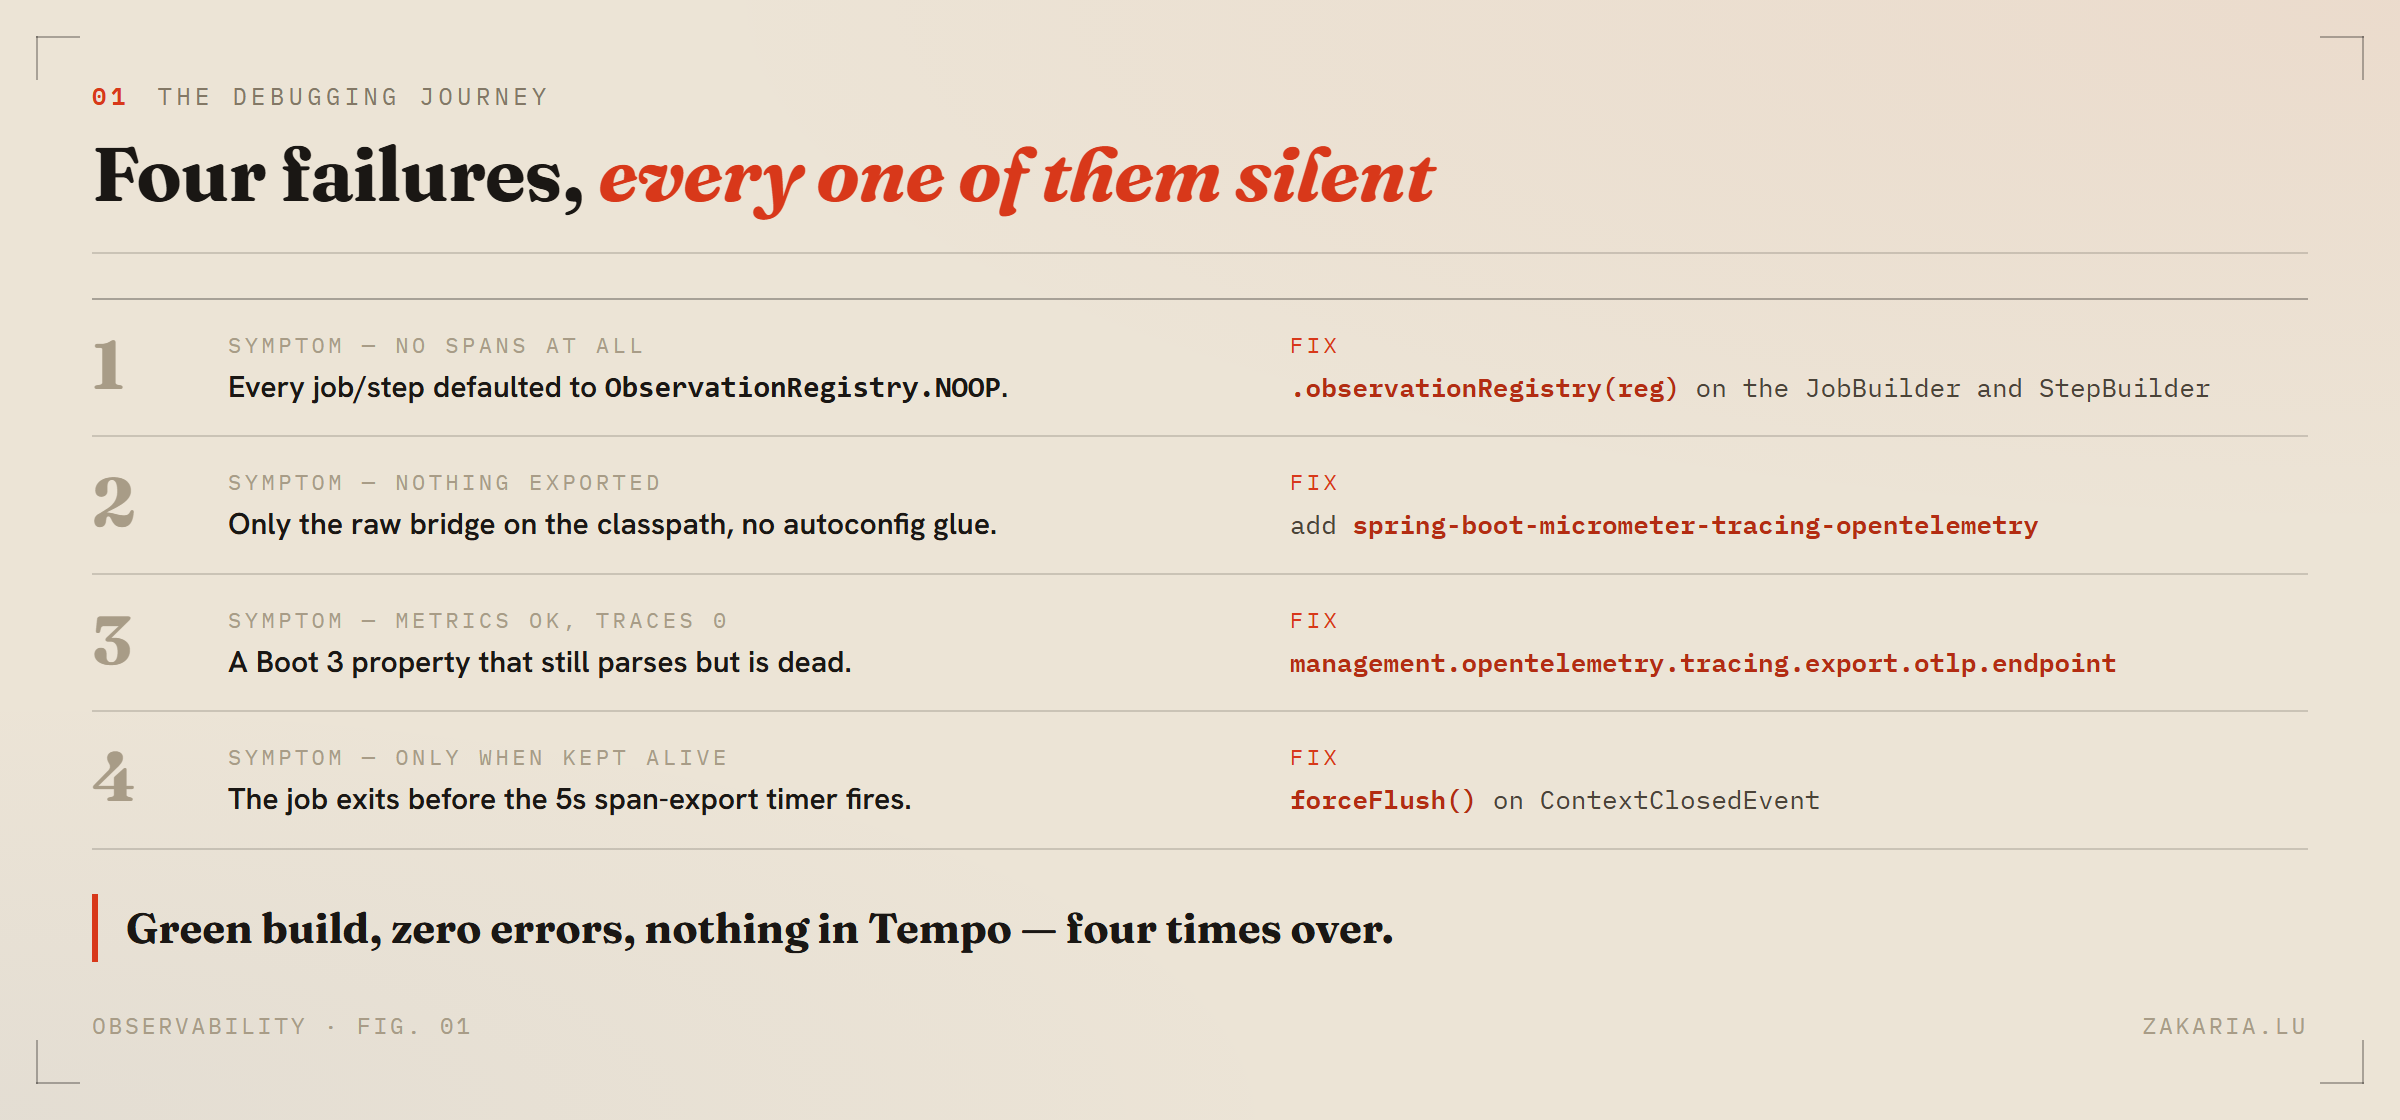
Four traps between a green build and a trace in Tempo.
1. The NOOP registry. Boot does not wire the ObservationRegistry into your job and step beans — they default to ObservationRegistry.NOOP, which emits nothing. You have to say so explicitly, on the builders:
new StepBuilder("demoStep", jobRepository)
    .observationRegistry(observationRegistry)   // without this: NOOP
    .<String, String>chunk(2)
    .transactionManager(tx)
    .reader(reader).processor(processor).writer(writer)
    .build();
The tidy-looking alternative — registering BatchObservabilityBeanPostProcessor — backfires if you declare it in the same @Configuration as the job: the config class instantiates early to produce the bean-factory post-processor, so the job and step beans are created before the processor can touch them.
2. The missing autoconfig module — covered above. This one cost me both traces and metrics at once.
3. The property that quietly died. Boot 4 renamed the OTLP tracing namespace. The old key still parses — no warning, no typo error — it is simply dead. Spans were generated and dropped on the floor because the exporter had no endpoint:
# Boot 3 (still parses, does nothing on Boot 4):
# management.otlp.tracing.endpoint=http://localhost:4318/v1/traces

# Boot 4 — the live one:
management.opentelemetry.tracing.export.otlp.endpoint=http://localhost:4318/v1/traces
4. The app exited before the flush. The span pipeline batches and exports on a ~5 second timer. A one-shot batch job finishes and the JVM exits in about a second and a half — the spans die in the buffer. Metrics did not have this problem, because the OTLP meter registry does a synchronous final publish on shutdown. The fix is the canonical one for any short-lived OTel process: block on a flush when the context closes.
@Component
class OtelFlushOnShutdown implements ApplicationListener<ContextClosedEvent> {
    private final OpenTelemetry otel;
    OtelFlushOnShutdown(OpenTelemetry otel) { this.otel = otel; }

    public void onApplicationEvent(ContextClosedEvent e) {
        if (otel instanceof OpenTelemetrySdk sdk) {
            sdk.getSdkTracerProvider().forceFlush().join(10, TimeUnit.SECONDS);
        }
    }
}
The metrics come for free
Once observations flow, the same wiring feeds Micrometer's meter handler, so the whole spring_batch_* family shows up in Prometheus with no extra work — job, step, item read/process, chunk write, each carrying job_name and step_name labels.
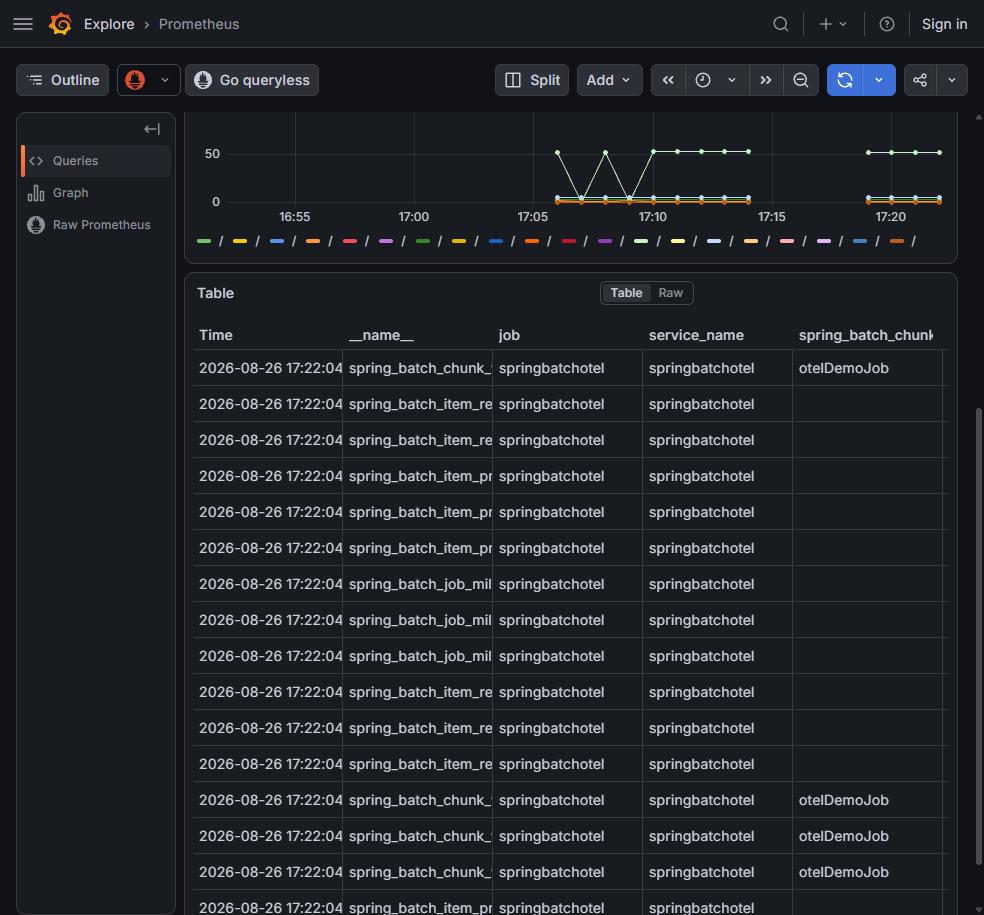
One query, {__name__=~"spring_batch.*"} — 40 series, none of which I registered by hand.
What I took away
The batch semantics only ever come from the framework, never the agent. And on Boot 4, “auto” still means a handful of deliberate enablement steps — the right module, the registry on the builders, the renamed property, a flush on exit. What made it hard was not difficulty but silence: four different mistakes, four green builds, four empty dashboards. Once you know they exist, the whole thing is about ten lines of glue. The full demo — a runnable Boot 4 / Batch 6 project with a Grafana LGTM docker run one-liner — is on my GitHub as springbatchotel.
Explore the code.