From Chat to Dinner Planner: Testing ChatGPT Visualizations
A headline about GPT-6 and an “intelligent UI” sent me looking for something concrete to try. The official documentation gave me a more precise target: ChatGPT Visualizations, a preview that can turn a conversation into a chart, diagram, calculator, or small interactive tool. I wanted to see what that meant beyond a polished demo.
I chose an ordinary planning problem: dinner for six. It has several inputs that should affect one another, and an answer I can inspect without pretending that a model knows the prices at my local supermarket.

The prompt
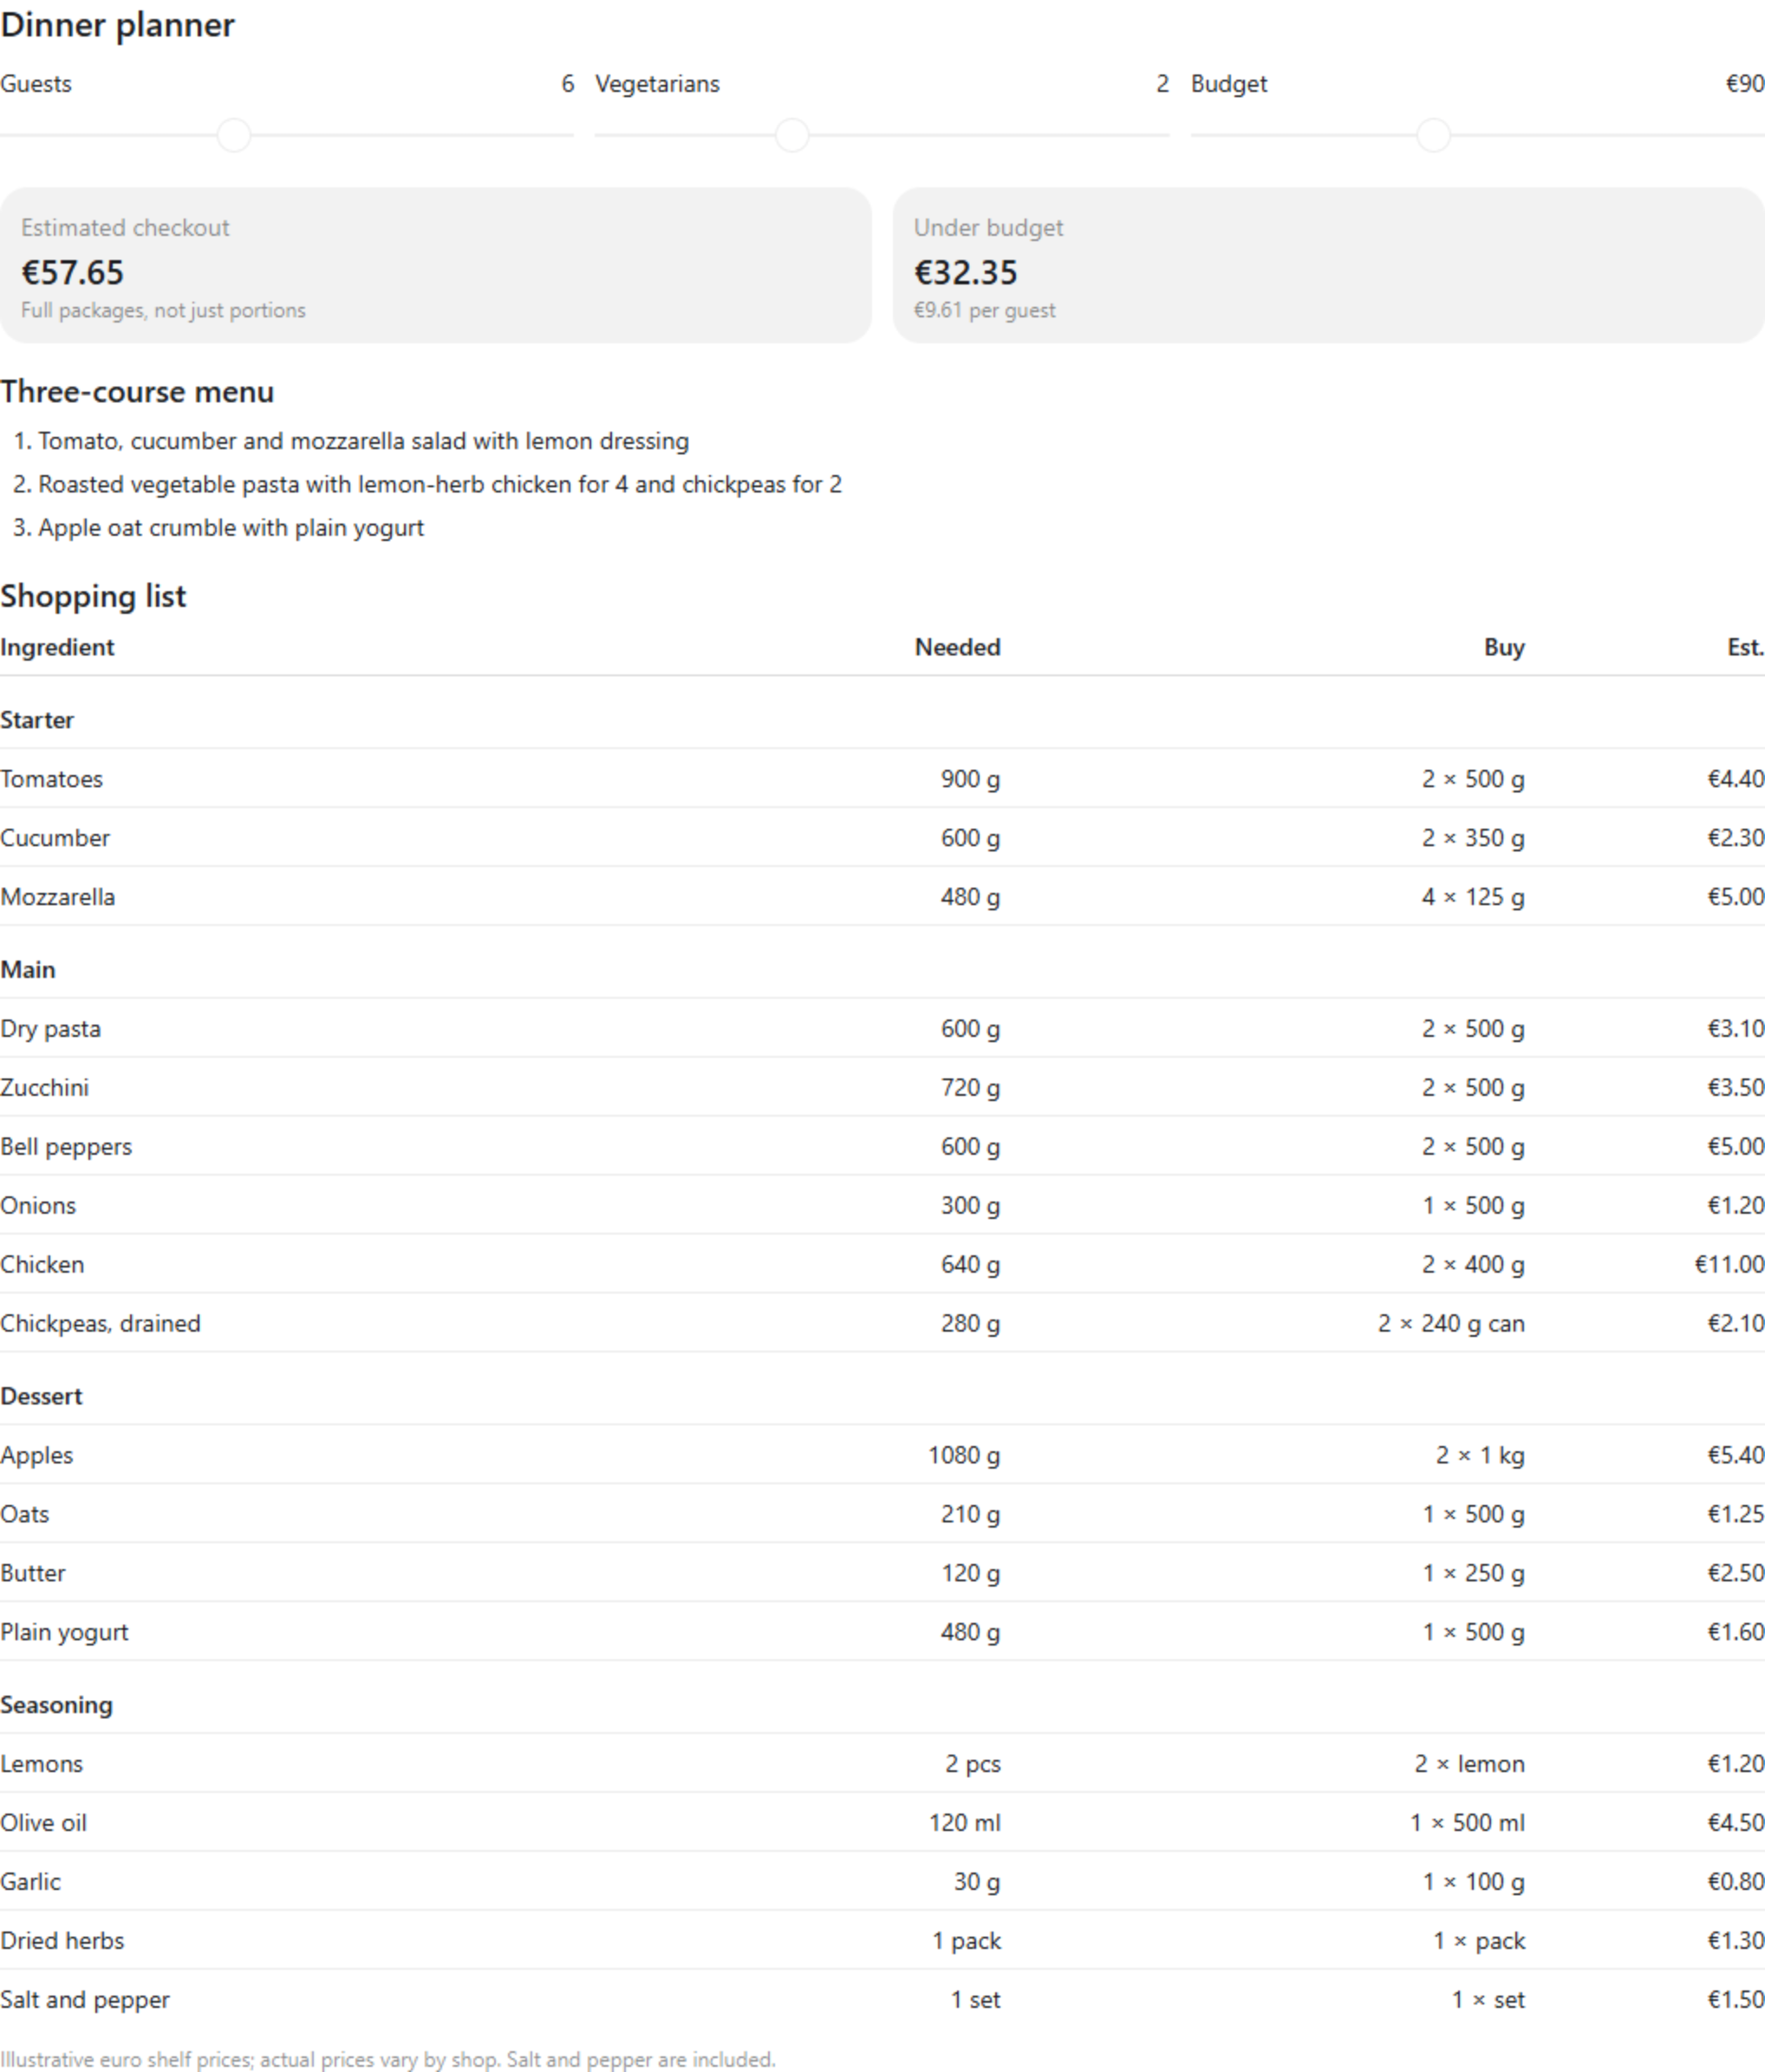
I’m planning dinner for 6 people, including 2 vegetarians, with a €90 budget. Suggest a three-course menu and a shopping list. Let me change the guest count, vegetarian count, and budget, and show how the ingredient quantities and estimated cost change.
In my Codex conversation I used the Visualize skill for the answer. The result was a dinner planner with three sliders, a menu, a shopping list, and a checkout estimate. Its main course gave chicken to the non-vegetarian guests and chickpeas to the vegetarian guests. The list showed both the quantity required for the recipe and the full packages to buy. That distinction matters: you cannot buy 640 g from a sealed 400 g chicken pack without buying two.
What changed when I moved the controls
I changed the planner to nine guests, four vegetarians, and a €180 budget. The menu adjusted its chicken and chickpea portions to five and four people. Tomatoes rose from 900 g to 1,350 g, changing the shopping quantity from two 500 g packs to three. Chickpeas rose from 280 g to 560 g, changing the purchase from two cans to three. The estimated checkout moved from €57.65 to €68.50.
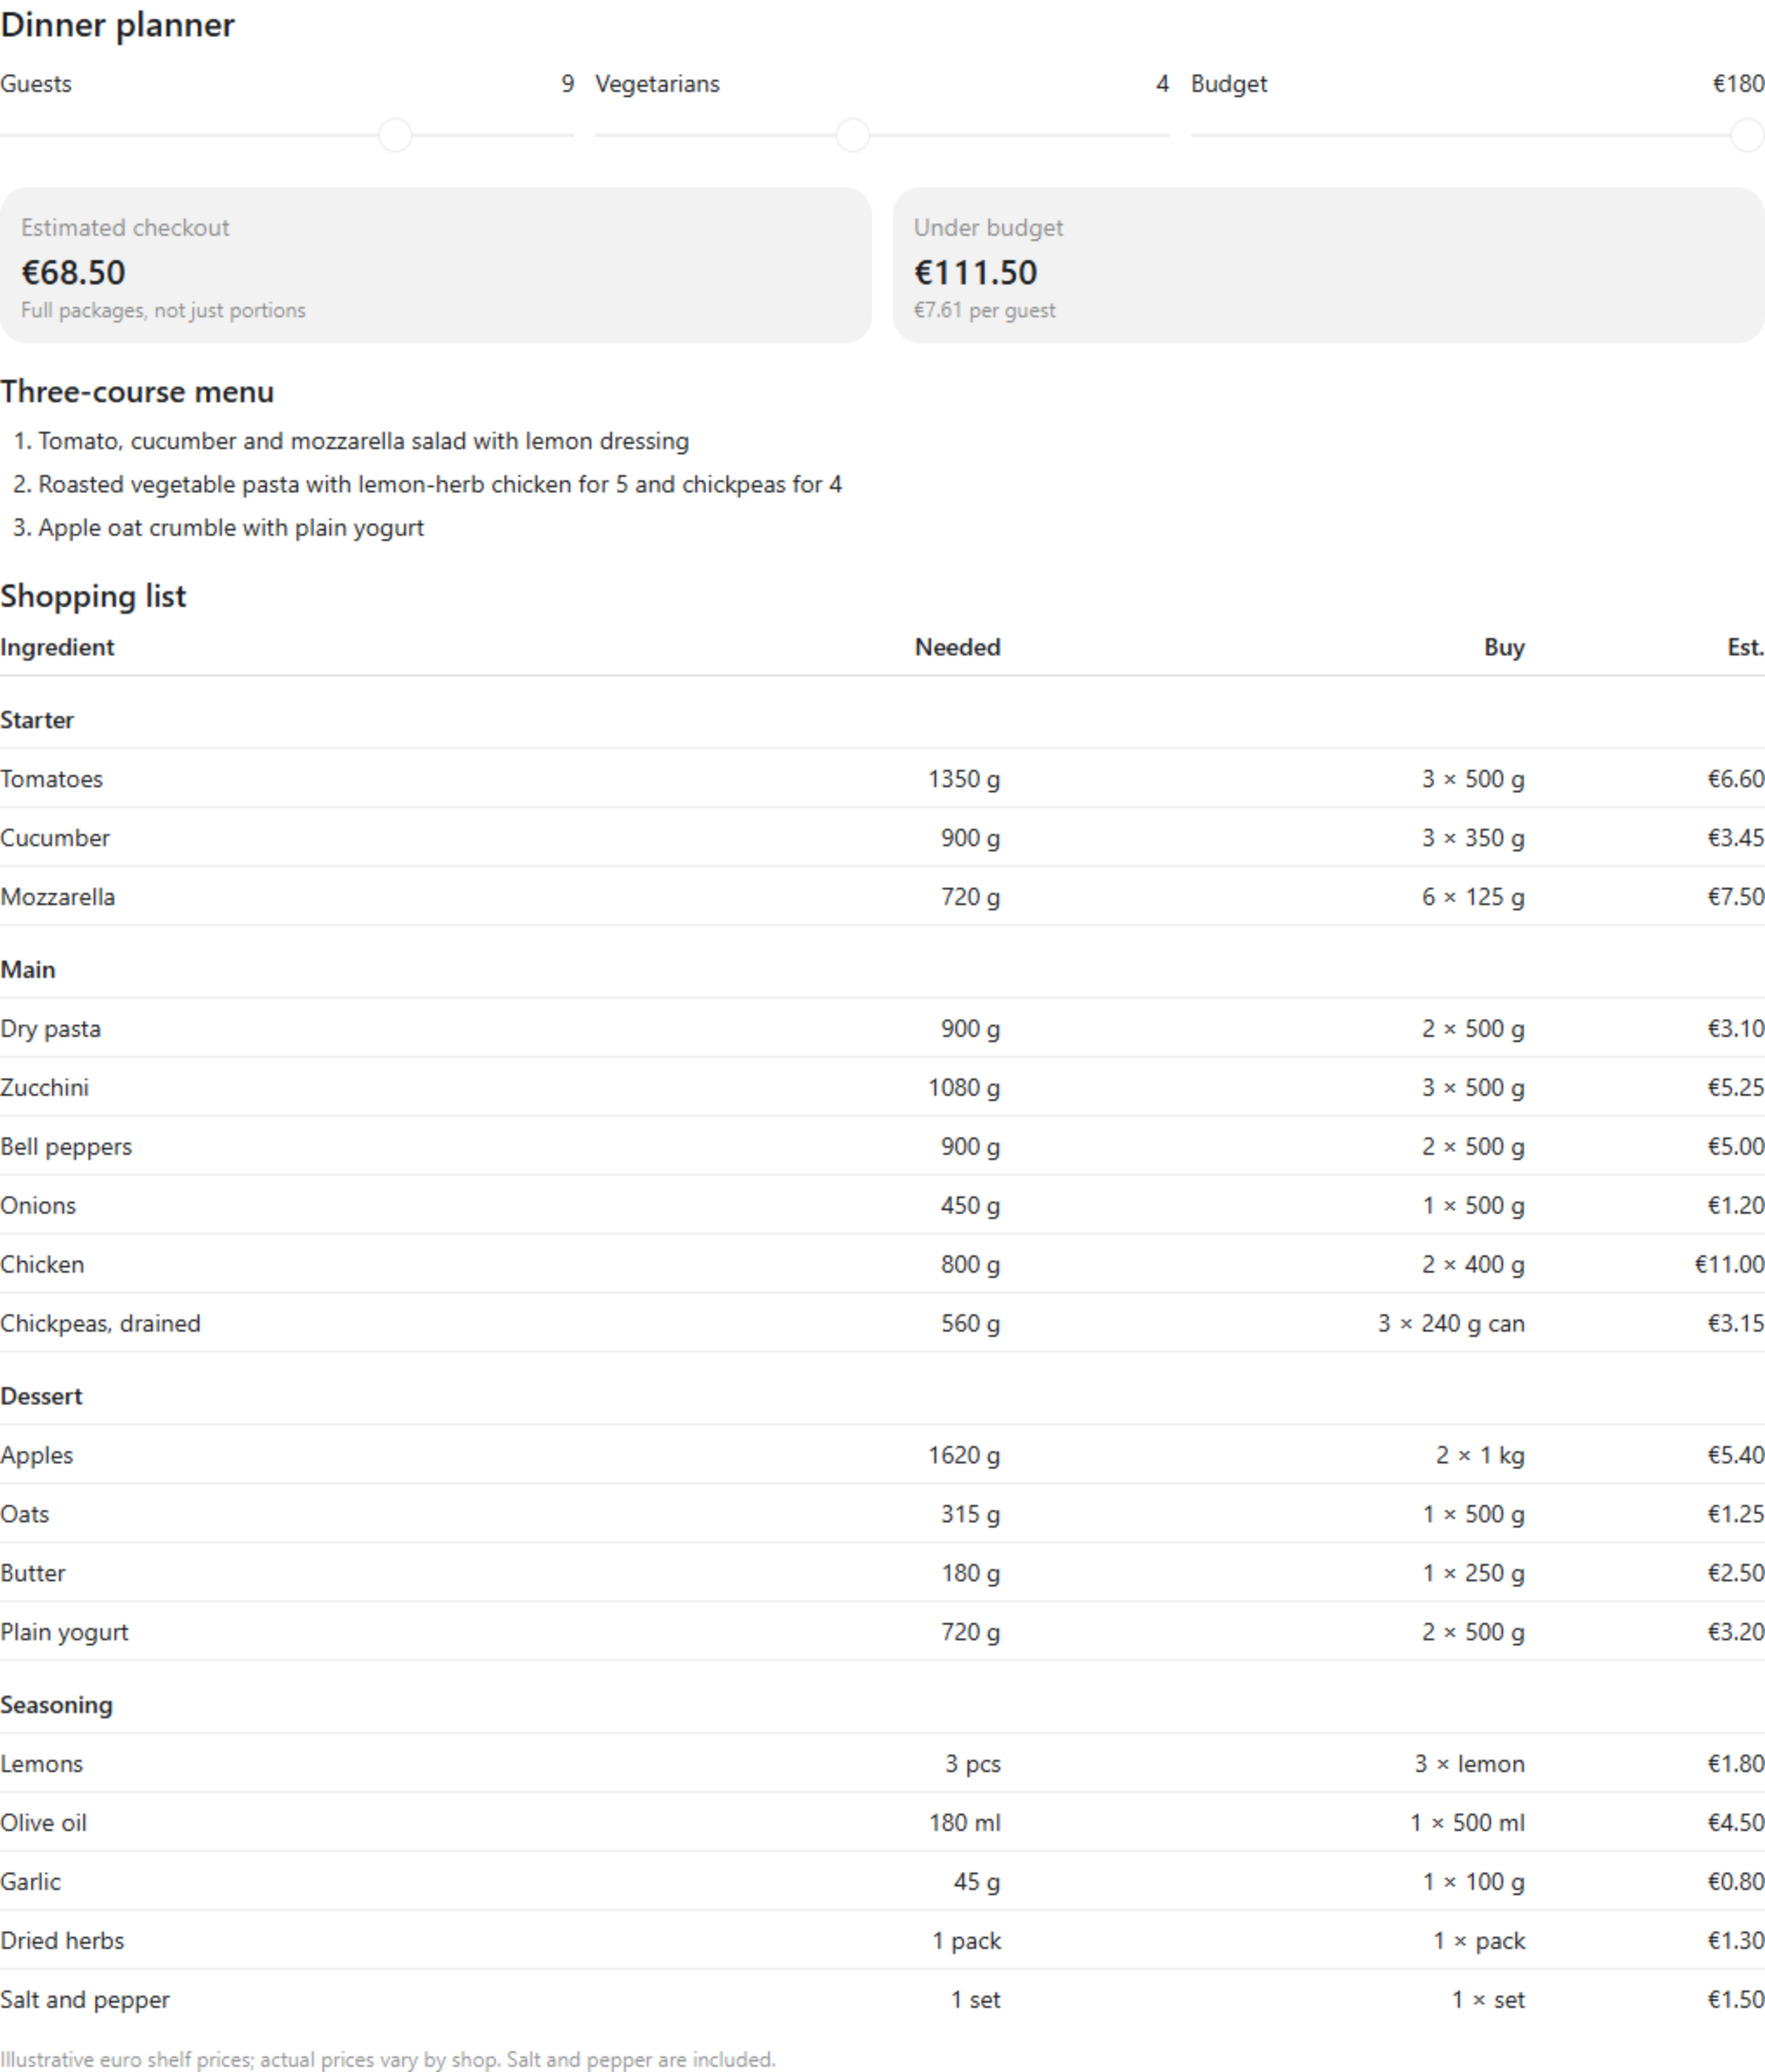
There is a useful nuance here. Changing the budget alone does not make the meal cheaper. It changes the displayed headroom. Guest count and dietary split drive ingredient quantities; package rounding drives the checkout estimate. The planner also uses illustrative example prices, not live retailer data. I would check actual shop prices before treating €68.50 as a real quote.
What this does, and what it does not prove
The interesting part is the interaction loop. A text answer could have listed a menu and a fixed shopping list. This result lets me change the problem while keeping the same menu and cost model in view. That makes assumptions easier to notice: portion sizes, whole-package purchases, and the fact that budget is currently a constraint display rather than a menu optimiser.
The screenshots are evidence of two states and of the figures I checked in the browser. They cannot show the feeling of dragging a slider, and they do not prove the tool has access to live pricing. For a shareable or persistent application, I would test the data, accessibility, and mobile layout, then build a proper hosted version. The Visualizations documentation describes these results as interactive explanations and notes that availability depends on plan, platform, account, and workspace settings.
I also would not label this a “GPT-6 launched in Chat with Intelligent UI” test. The official model documentation separates GPT-6 availability in Work and Codex from ordinary Chat, while the Visualizations page describes a separate preview. I did not record a model identifier for this particular turn. The reproducible claim here is narrower and more useful: I asked for adjustable planning inputs, used Visualize, changed the controls, and observed the resulting quantities and estimate.
Try the same experiment
Start with a question whose answer should change when you change an input: a dinner plan, a project budget, a loan comparison, or a small physics example. Name the controls and the outputs that should update. If Visualize is available in your ChatGPT composer, select @Visualize; the documentation says ChatGPT can also choose a visual format when it materially improves the answer. Then try an edge case, check the arithmetic, and ask which data is real and which is assumed.
For me, the value was not that the chat looked more graphical. It was that the answer became inspectable. The best interactive responses give me a place to test the model’s assumptions instead of merely reading them.