Codex Meets IntelliJ's Debugger: MCP on a Tiny Play App
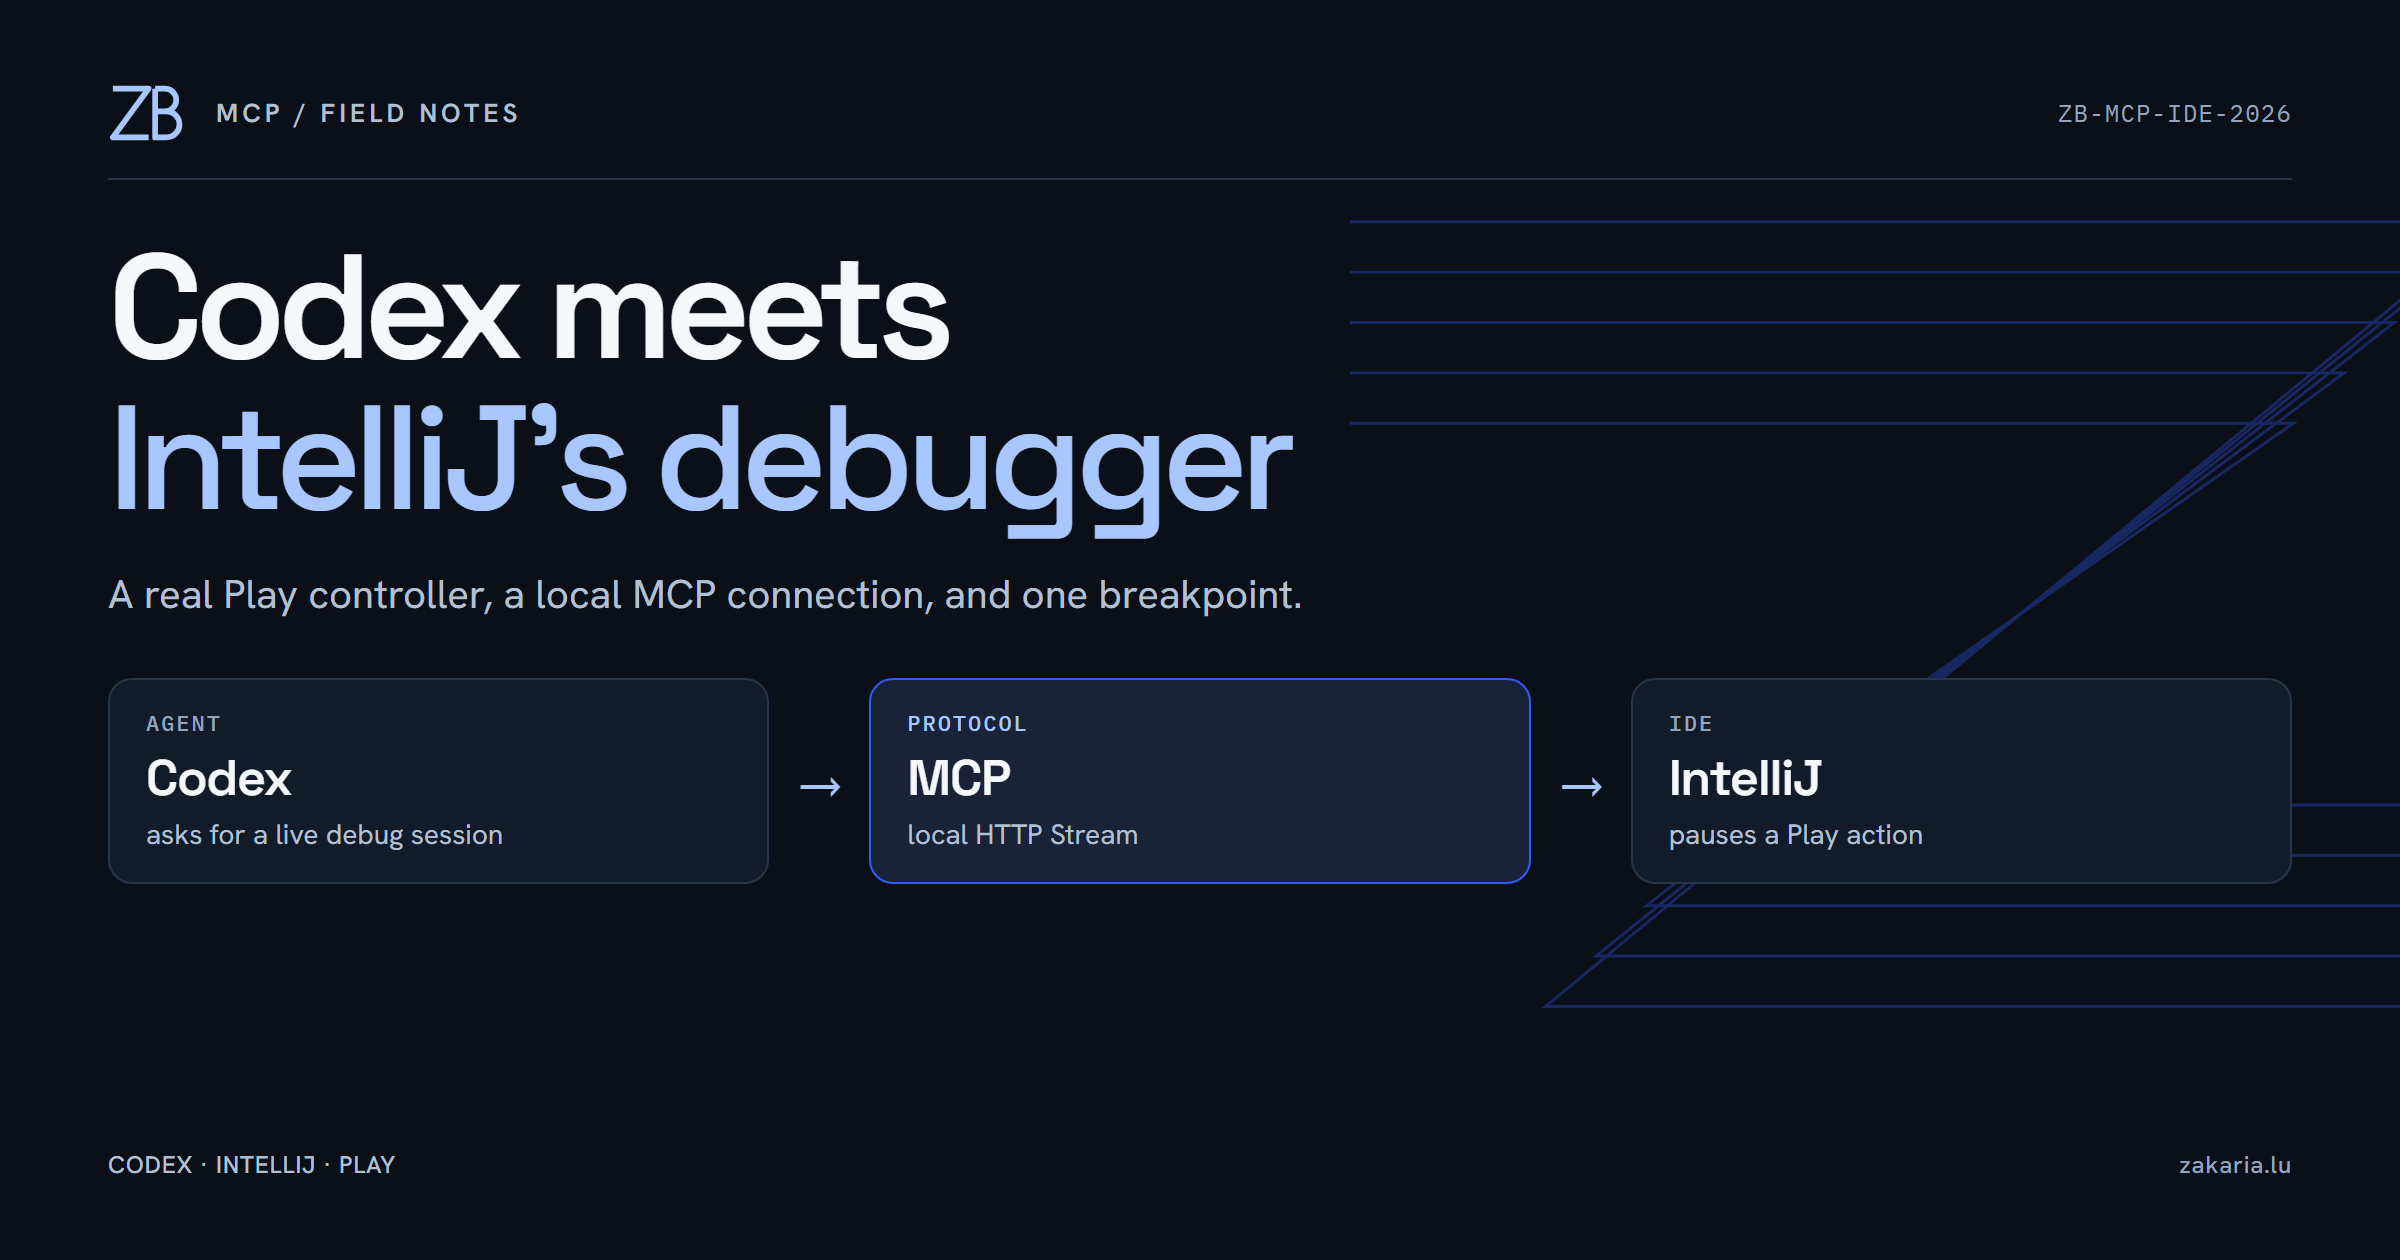
I have been using a tiny Play 3 project to learn the framework from a Java and Spring background. It has one route, one controller and one greeting. That made it a useful place to try something else: connect Codex to the IntelliJ IDEA instance already running the project, then ask it to use the IDE's debugger over MCP.
The experiment worked. Codex could discover the project, launch a debug session, hit a breakpoint in my controller and read the local value after one step. The interesting part was not the greeting. It was seeing where the boundary sits between an agent reading files and an agent asking the IDE for live runtime evidence.

A project small enough to see through
The application has a Play route in conf/routes:
GET /hello controllers.HelloController.helloThe target is a controller in app/controllers/HelloController.scala:
def hello: Action[AnyContent] = Action {
  val message: String = "Hello Zakaria! Your first Play app is running."
  val response: Result = Ok(message)
  response
}
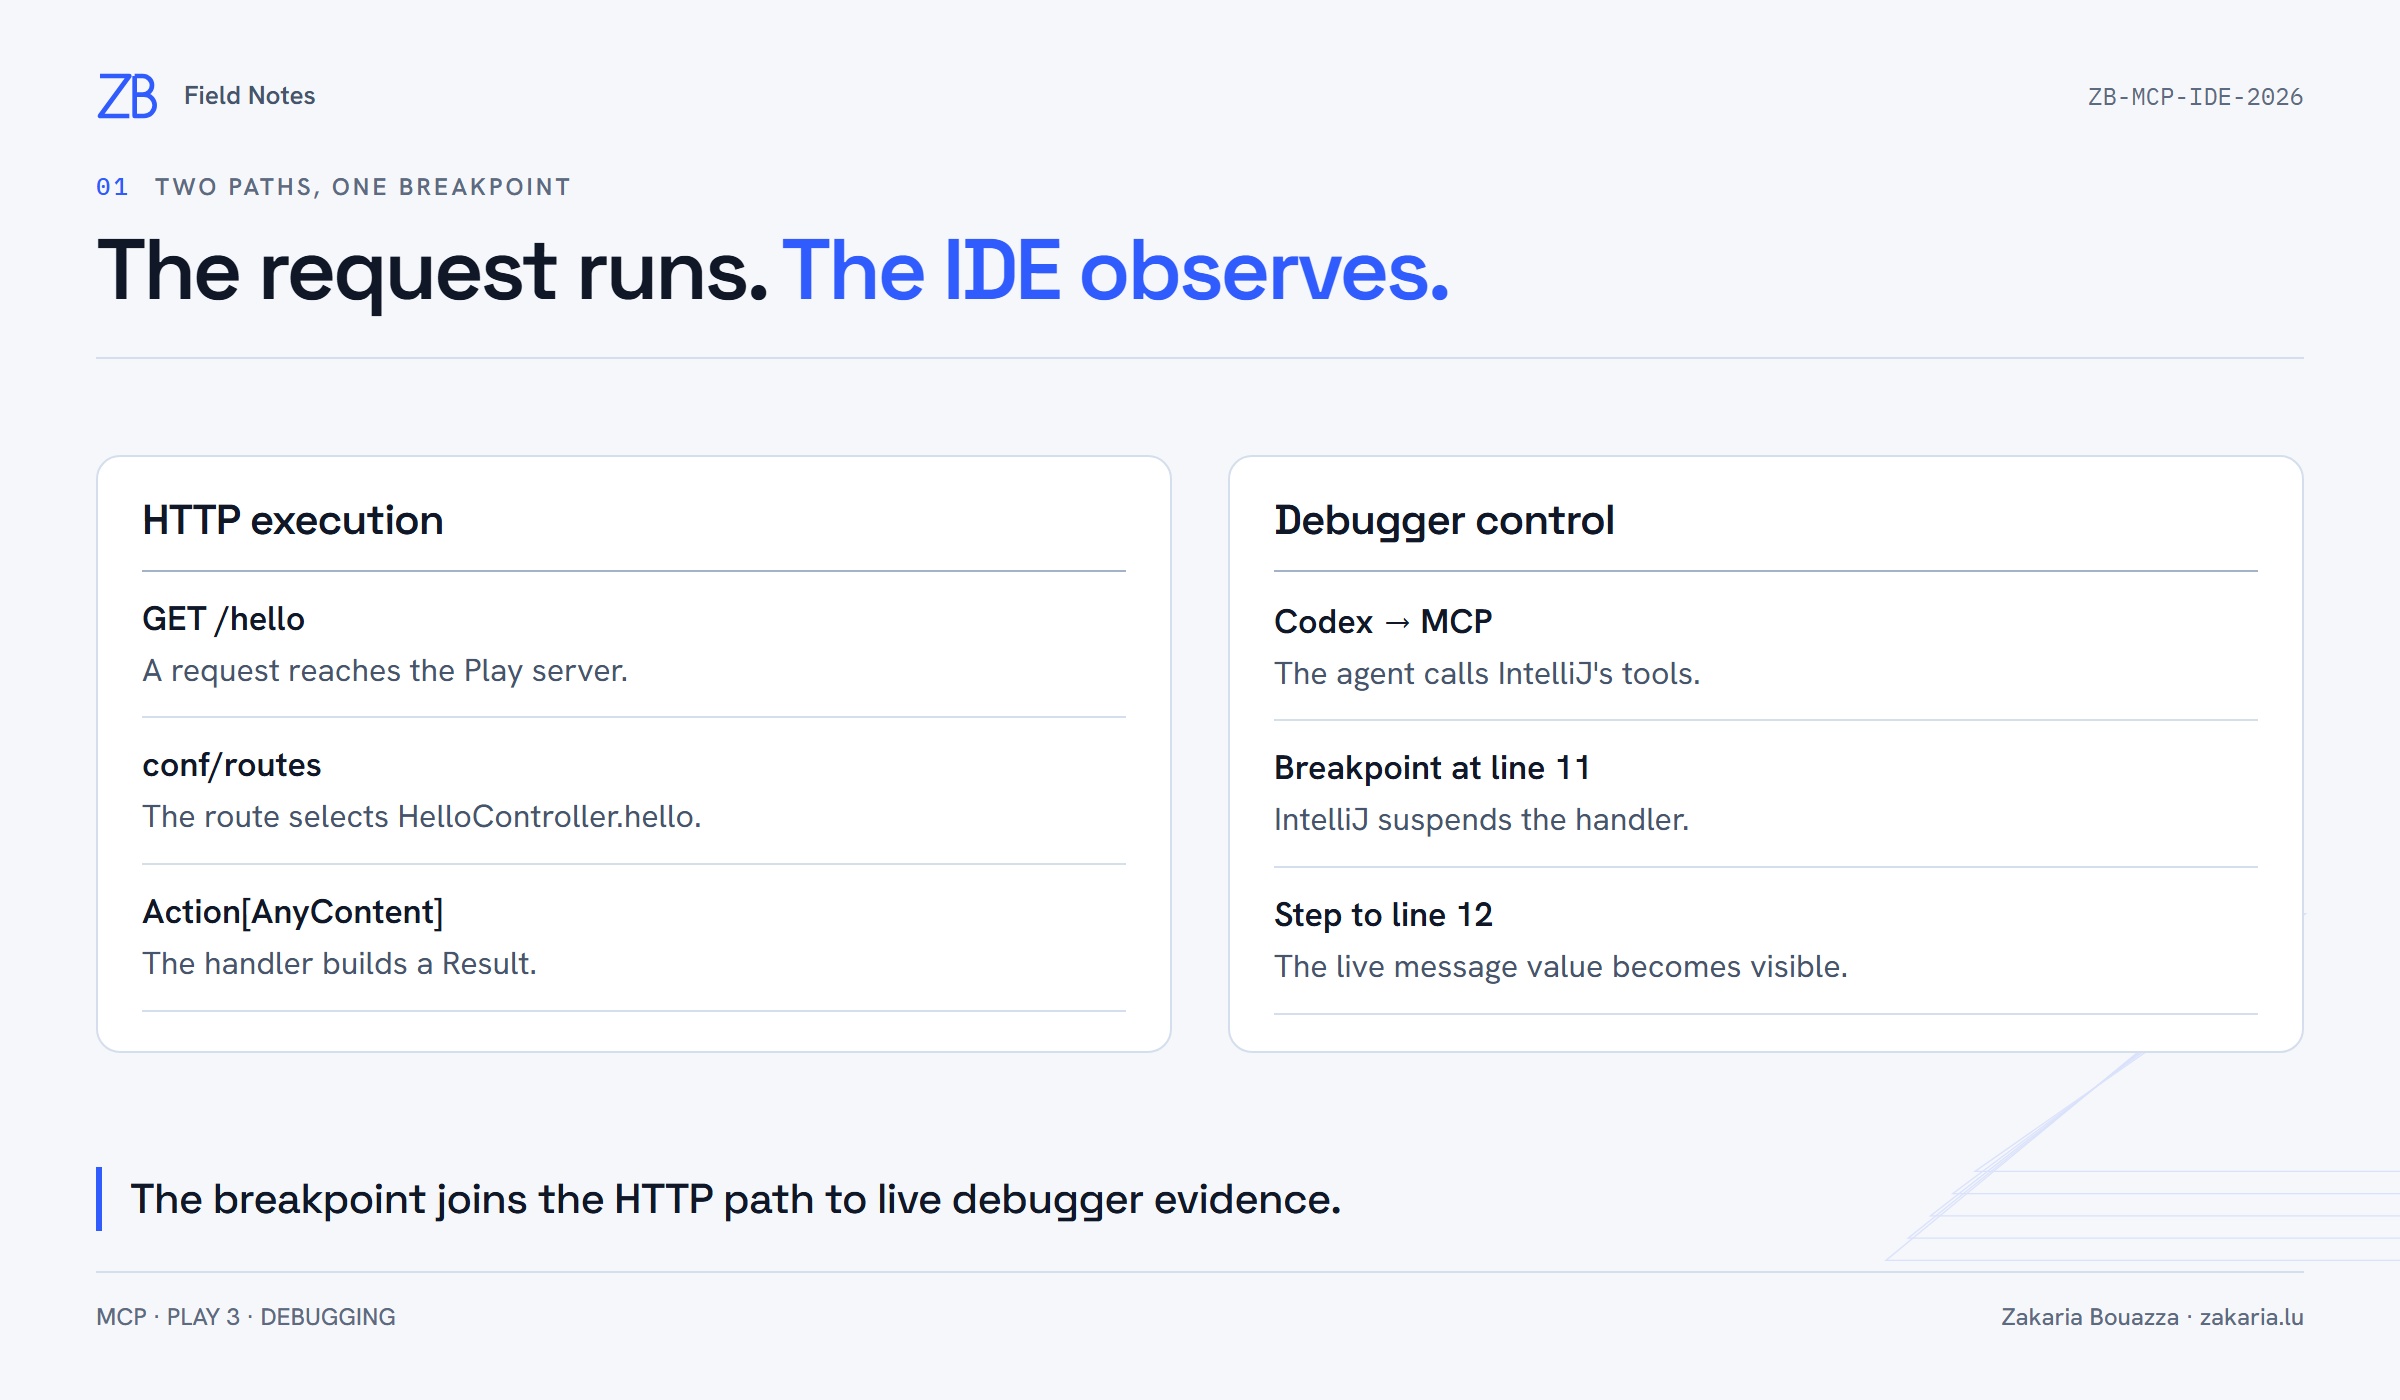
When a browser calls GET /hello, the route selects hello; the action constructs a Result; Play sends that result as the HTTP response. There is no database, actor or asynchronous branch to hide behind. That simplicity made the debugger trace easy to verify.
Codex connected to the IDE I already had open
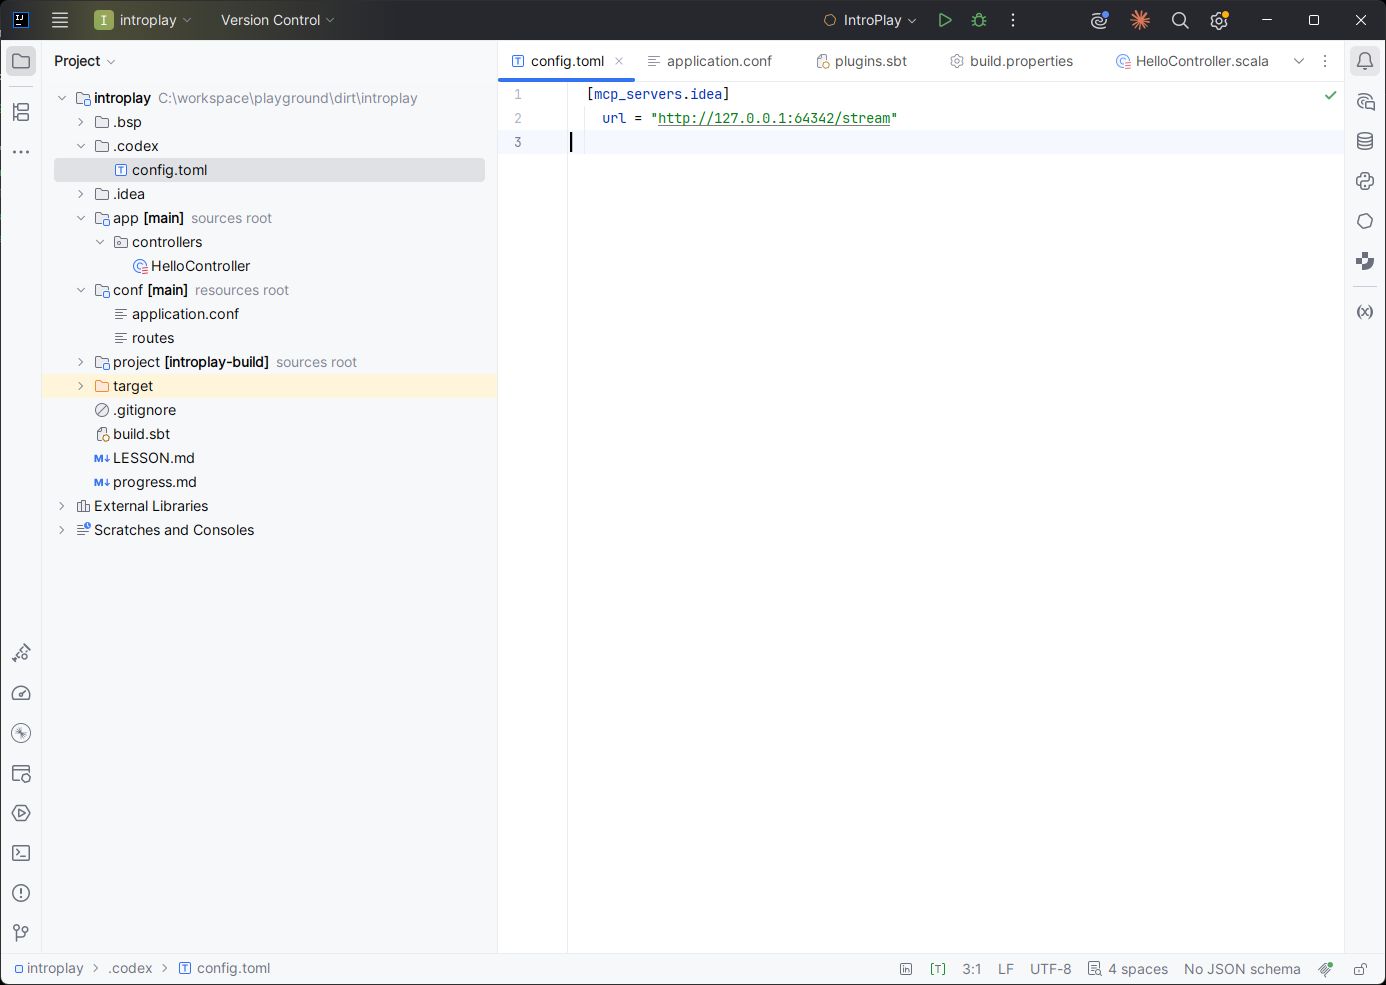
IntelliJ IDEA 2026.2.1 had its MCP server enabled on a local HTTP Stream endpoint. Its project auto-configuration had already placed the following entry in .codex/config.toml:
[mcp_servers.idea]
url = "http://127.0.0.1:64342/stream"
I checked the connection in the current Codex session. The server completed the MCP handshake and advertised 73 tools. More concretely, an IntelliJ tool returned the modules of this project, including its main, test and sbt-build modules. I did not need to restart Codex. The connection was already live.
What else did IntelliJ expose?
The debugger is only one part of the connection. I grouped the 73 advertised tools by the work they support:
| Area | Count | What Codex can ask IntelliJ to do |
|---|---|---|
| Project and editor | 25 | Read files, search text or symbols, inspect callers and dependencies, find file problems, build, run a configuration, check Git status, edit and refactor code. |
| Code inspection | 5 | Generate a PSI tree and run custom IntelliJ inspections. |
| Debugger | 13 | Set breakpoints, step, inspect frames and variables, evaluate expressions. |
| Databases | 14 | Inspect connected schemas, preview table rows and run SQL queries. |
| Notebooks and Python | 12 | Read or edit notebooks, run cells and inspect a Python environment. |
| Observability | 4 | Read log records, traces, services and a service map. |
For this Play app, the project and editor tools are useful even before setting a breakpoint. search_symbol and get_symbol_info can locate a controller method and explain the IDE's view of it; analyze_calls can trace callers; get_file_problems can surface IDE diagnostics; get_project_dependencies can show what sbt imported. The same connection also offers build_project, execute_run_configuration, execute_terminal_command and rename_refactoring, so it can take actions as well as answer questions.
I directly used the module, run-configuration and debugger tools in this experiment. The database, notebook and observability tools were advertised by the server; this tiny project did not exercise them. Their availability also depends on the IDE's project context, such as a configured database connection. A local MCP address is a transport detail, not a read-only guarantee: I treated this as a real IDE session with real write capabilities.
The run configuration was the first useful failure
There was no saved run configuration. I first tried an IntelliJ Play App configuration. In this imported project, that launcher started sbt from the generated .idea/modules/introplay directory rather than the repository root. Sbt then reported Not a valid project ID: introplay_3082. That failure says something about this local import and configuration; it is not a general rule about Play projects.
I saved an sbt Task configuration instead: run the run task from the project directory, with IntelliJ's sbt-shell mode off for this debug launch. That started Play 3.0.10, and the startup log showed the Pekko HTTP server listening on 127.0.0.1:9000. The saved configuration makes the experiment repeatable in this checkout.
The breakpoint supplied the evidence
Through the IntelliJ MCP tools, I placed a breakpoint on the line assigning message, started the debug session and sent one request to /hello. The HTTP client timed out while the debugger held the request at the breakpoint. That timeout was expected: the server could not finish this request while its handler was paused.
One step over moved execution to val response: Result = Ok(message). IntelliJ reported the local value:
message = "Hello Zakaria! Your first Play app is running."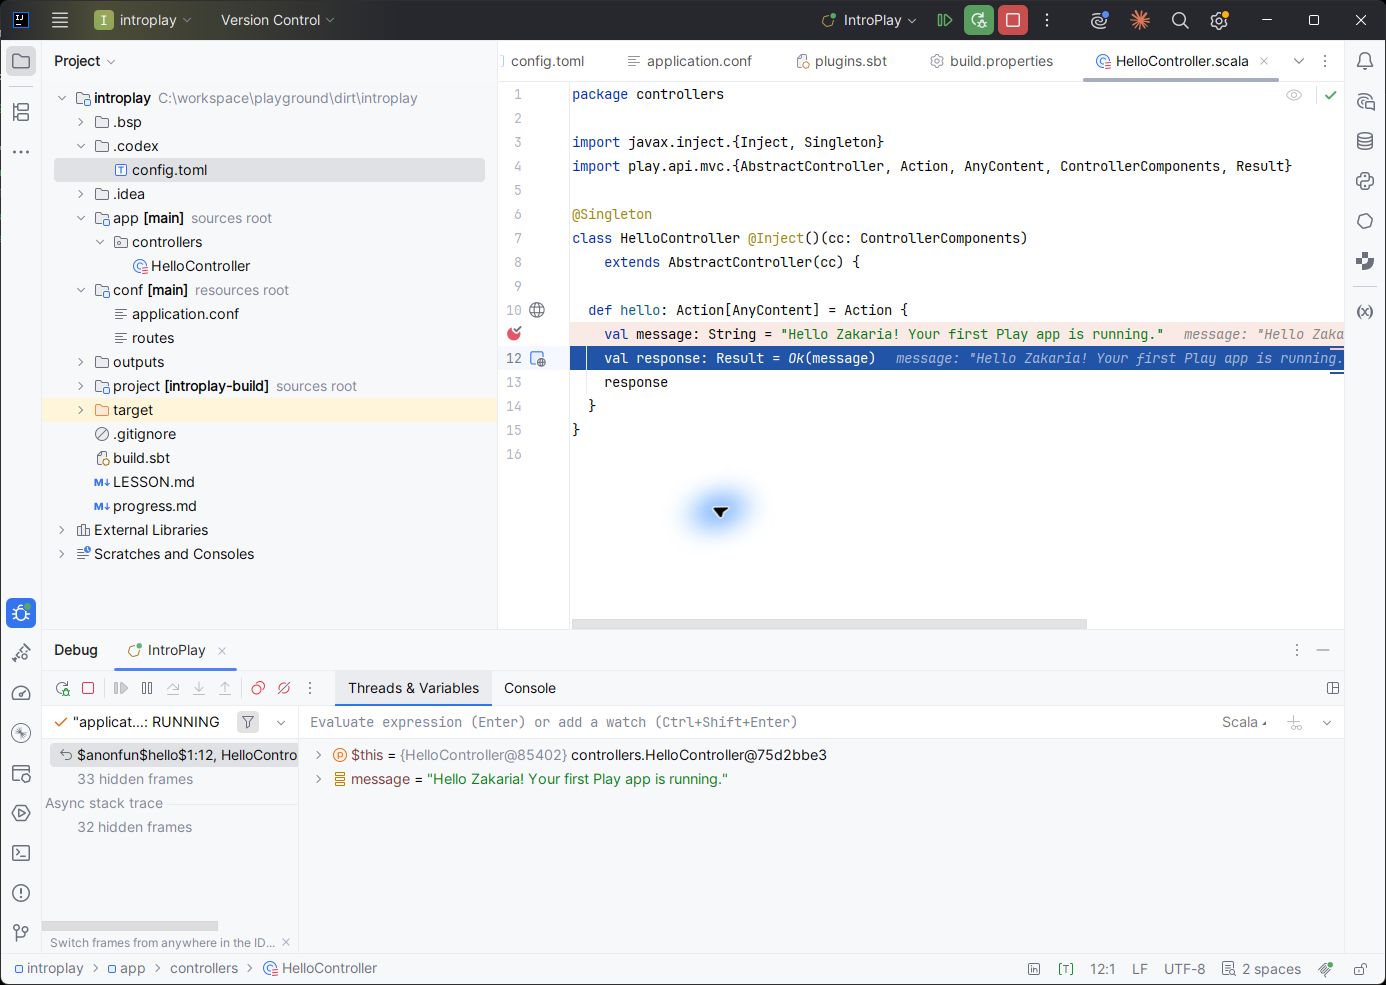
This is the distinction I wanted to test. Reading the source can tell Codex what the assignment says. The debugger shows what the running program reached and what value exists in that frame. On a larger endpoint, that difference matters when branches, dependency injection and request-specific data enter the picture.
Two Play details the example exposed
First, Play changes the usual sbt directory layout. In this application, app/ contains Scala sources and conf/ holds configuration and routes. Those roughly correspond to src/main/scala and src/main/resources in a conventional sbt project. Play's layout plugin chooses those defaults; Play can also be configured to use the standard sbt layout. The Play 3 application layout guide documents both forms.
Second, AnyContent in Action[AnyContent] describes the parsed request body. It does not mean that the action returns arbitrary content. The default body parser produces AnyContent, and the action returns a Result. Our GET /hello does not use a request body at all. A future JSON endpoint could select a JSON parser and use Action[JsValue] instead. The Play 3 body parser guide makes that type relationship explicit.
What I am keeping
The tiny endpoint remains a learning exercise, but the IDE connection changed how I can explore it. Codex can ask IntelliJ about modules, launch configurations, breakpoints, stack frames and live values. When a framework abstraction is confusing, I can move from reading an explanation to pausing a real request at the line where the abstraction becomes concrete.
The next Play lesson will add a URL path parameter and trace it into a typed controller method. I now have a debugger path ready for that experiment.