A pentest agent fleet against my own site: what the architecture got right
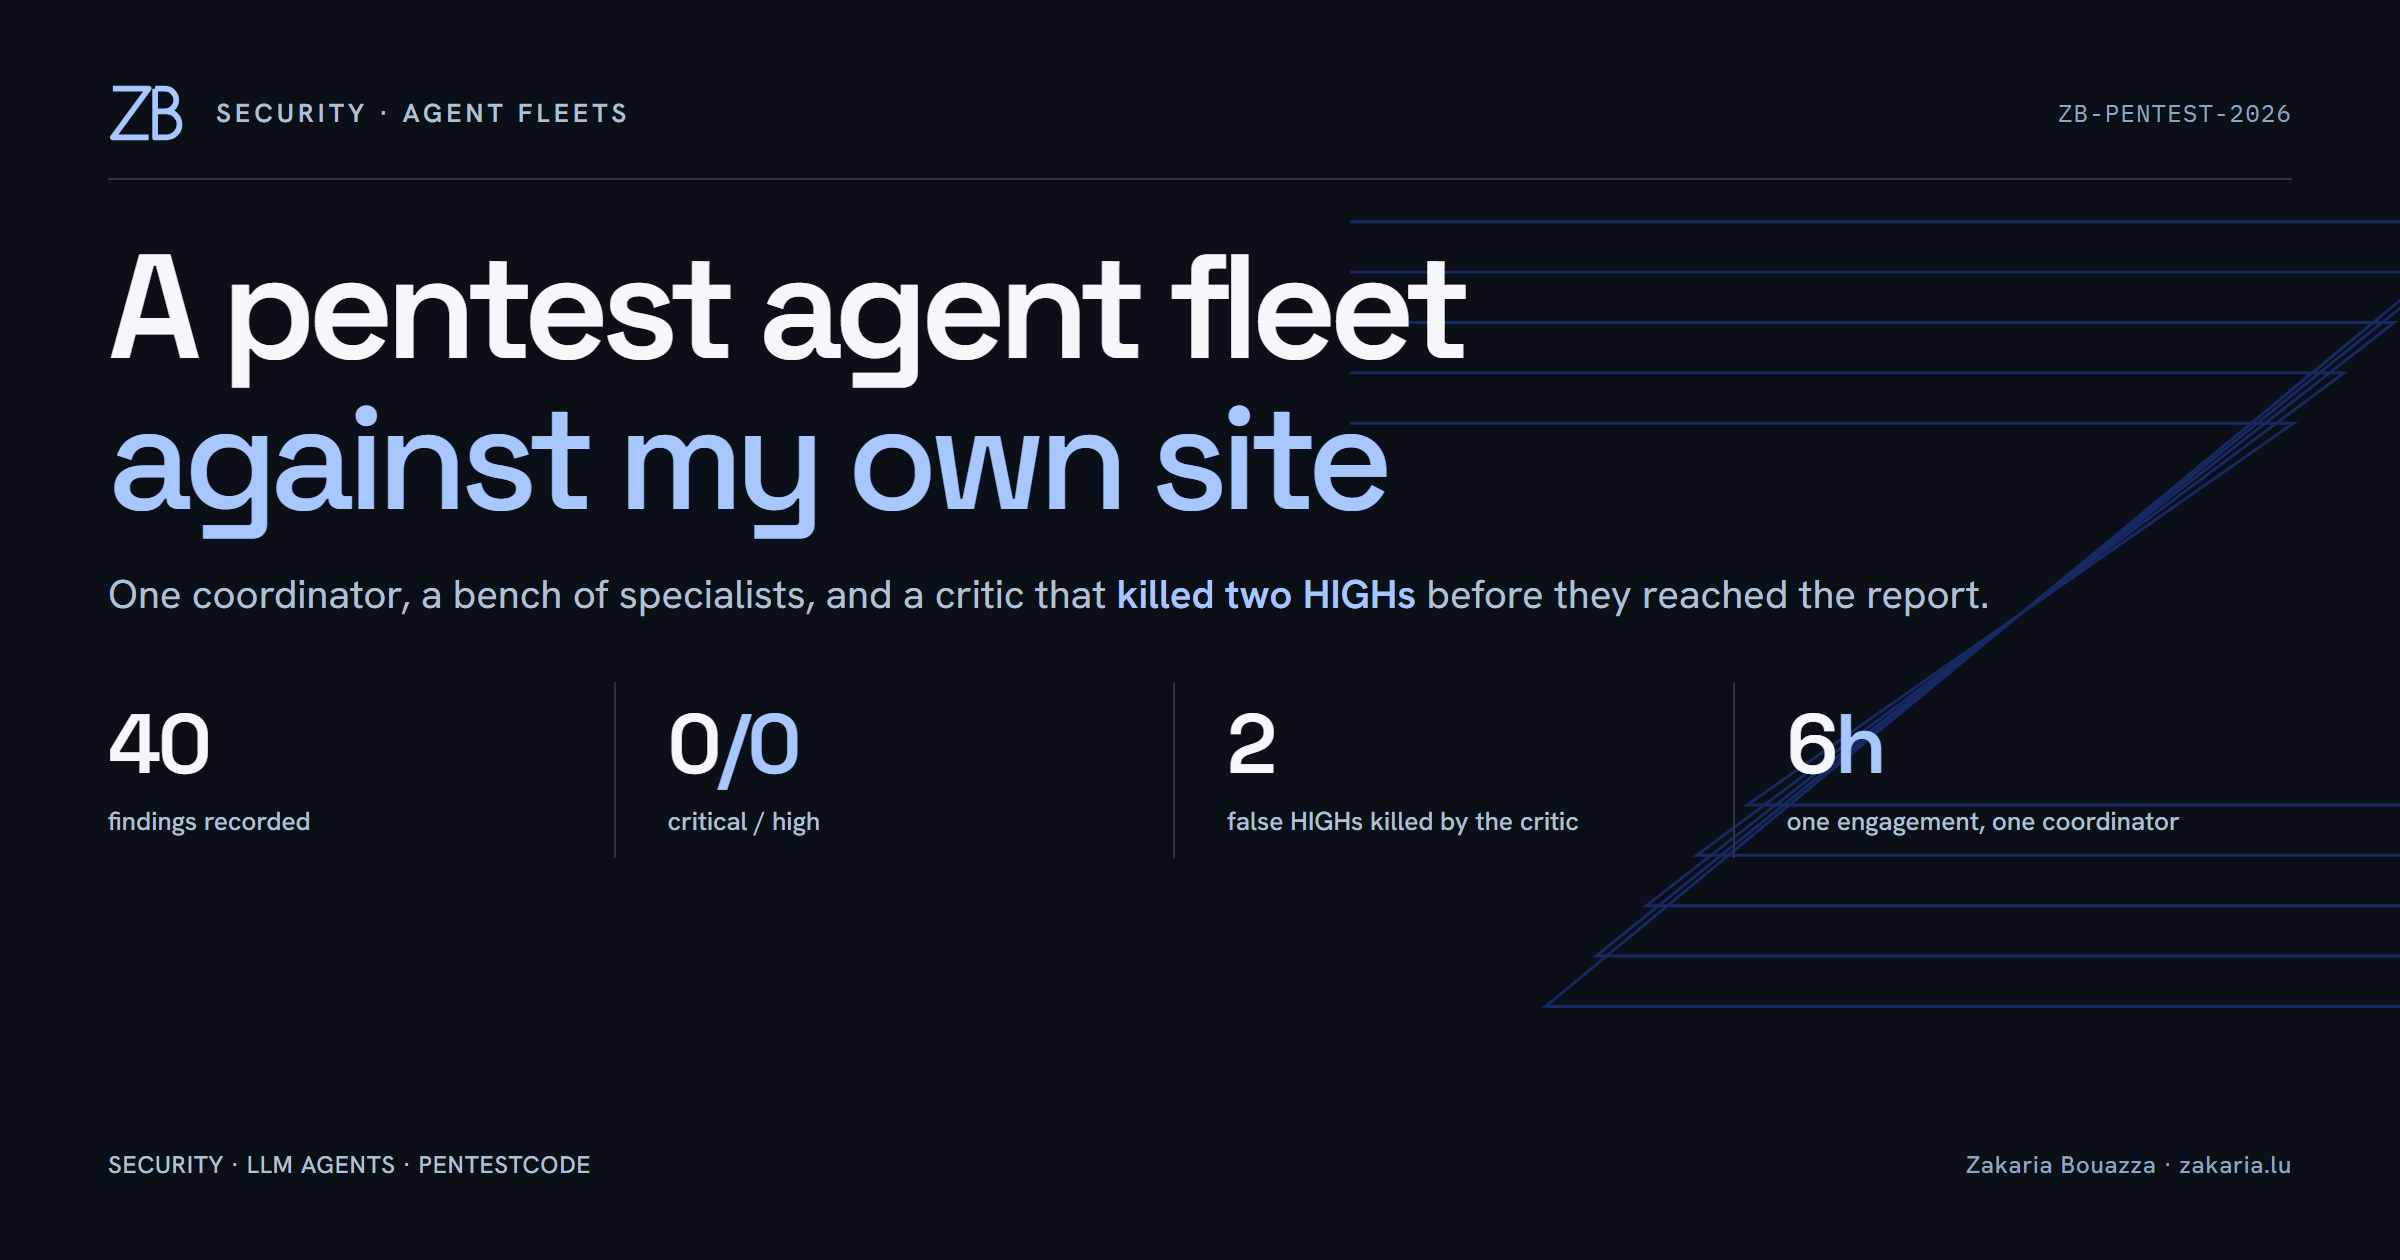
On 1 November I authorised a penetration test against everything I run under zakaria.lu: the apex site, the blog, BuildCV, FOCUS, the MCP side-car, the observability stack and production Keycloak. The rules of engagement were aggressive, with one hard limit I repeated twice: no denial of service. No load testing, no floods, no brute force that could lock an account or slow the site down for a real visitor.
The tester was not a person. It was PentestCode, an open-source terminal agent by s0ld13rr. It is a hard fork of OpenCode with the code-editing parts stripped out and rebuilt for offensive security. I ran it with DeepSeek V4.1 Flash for a little over six hours. When it finished, I asked it one question: how do you do pentest, present the architecture here. This post is about that answer, because the architecture is more interesting than the findings.
What I am not publishing
The report has 40 findings: 0 critical, 0 high, 4 medium, 9 low and 27 informational. Some are about infrastructure I don't control, such as the shared mail host. Others are about my own configuration and are not fixed yet. None of them are in this post. The open ones stay private until they are closed. What I can show is how the agent reached those numbers, including the two HIGHs it threw away.
Two planes and one shared state
In its own words the coordinator calls itself a control plane. It owns scope and the rules of engagement. It reads the engagement state, plans work in waves, decides when to pivot or stop, and correlates single findings into chains. The line I liked best: it never runs a shell itself.
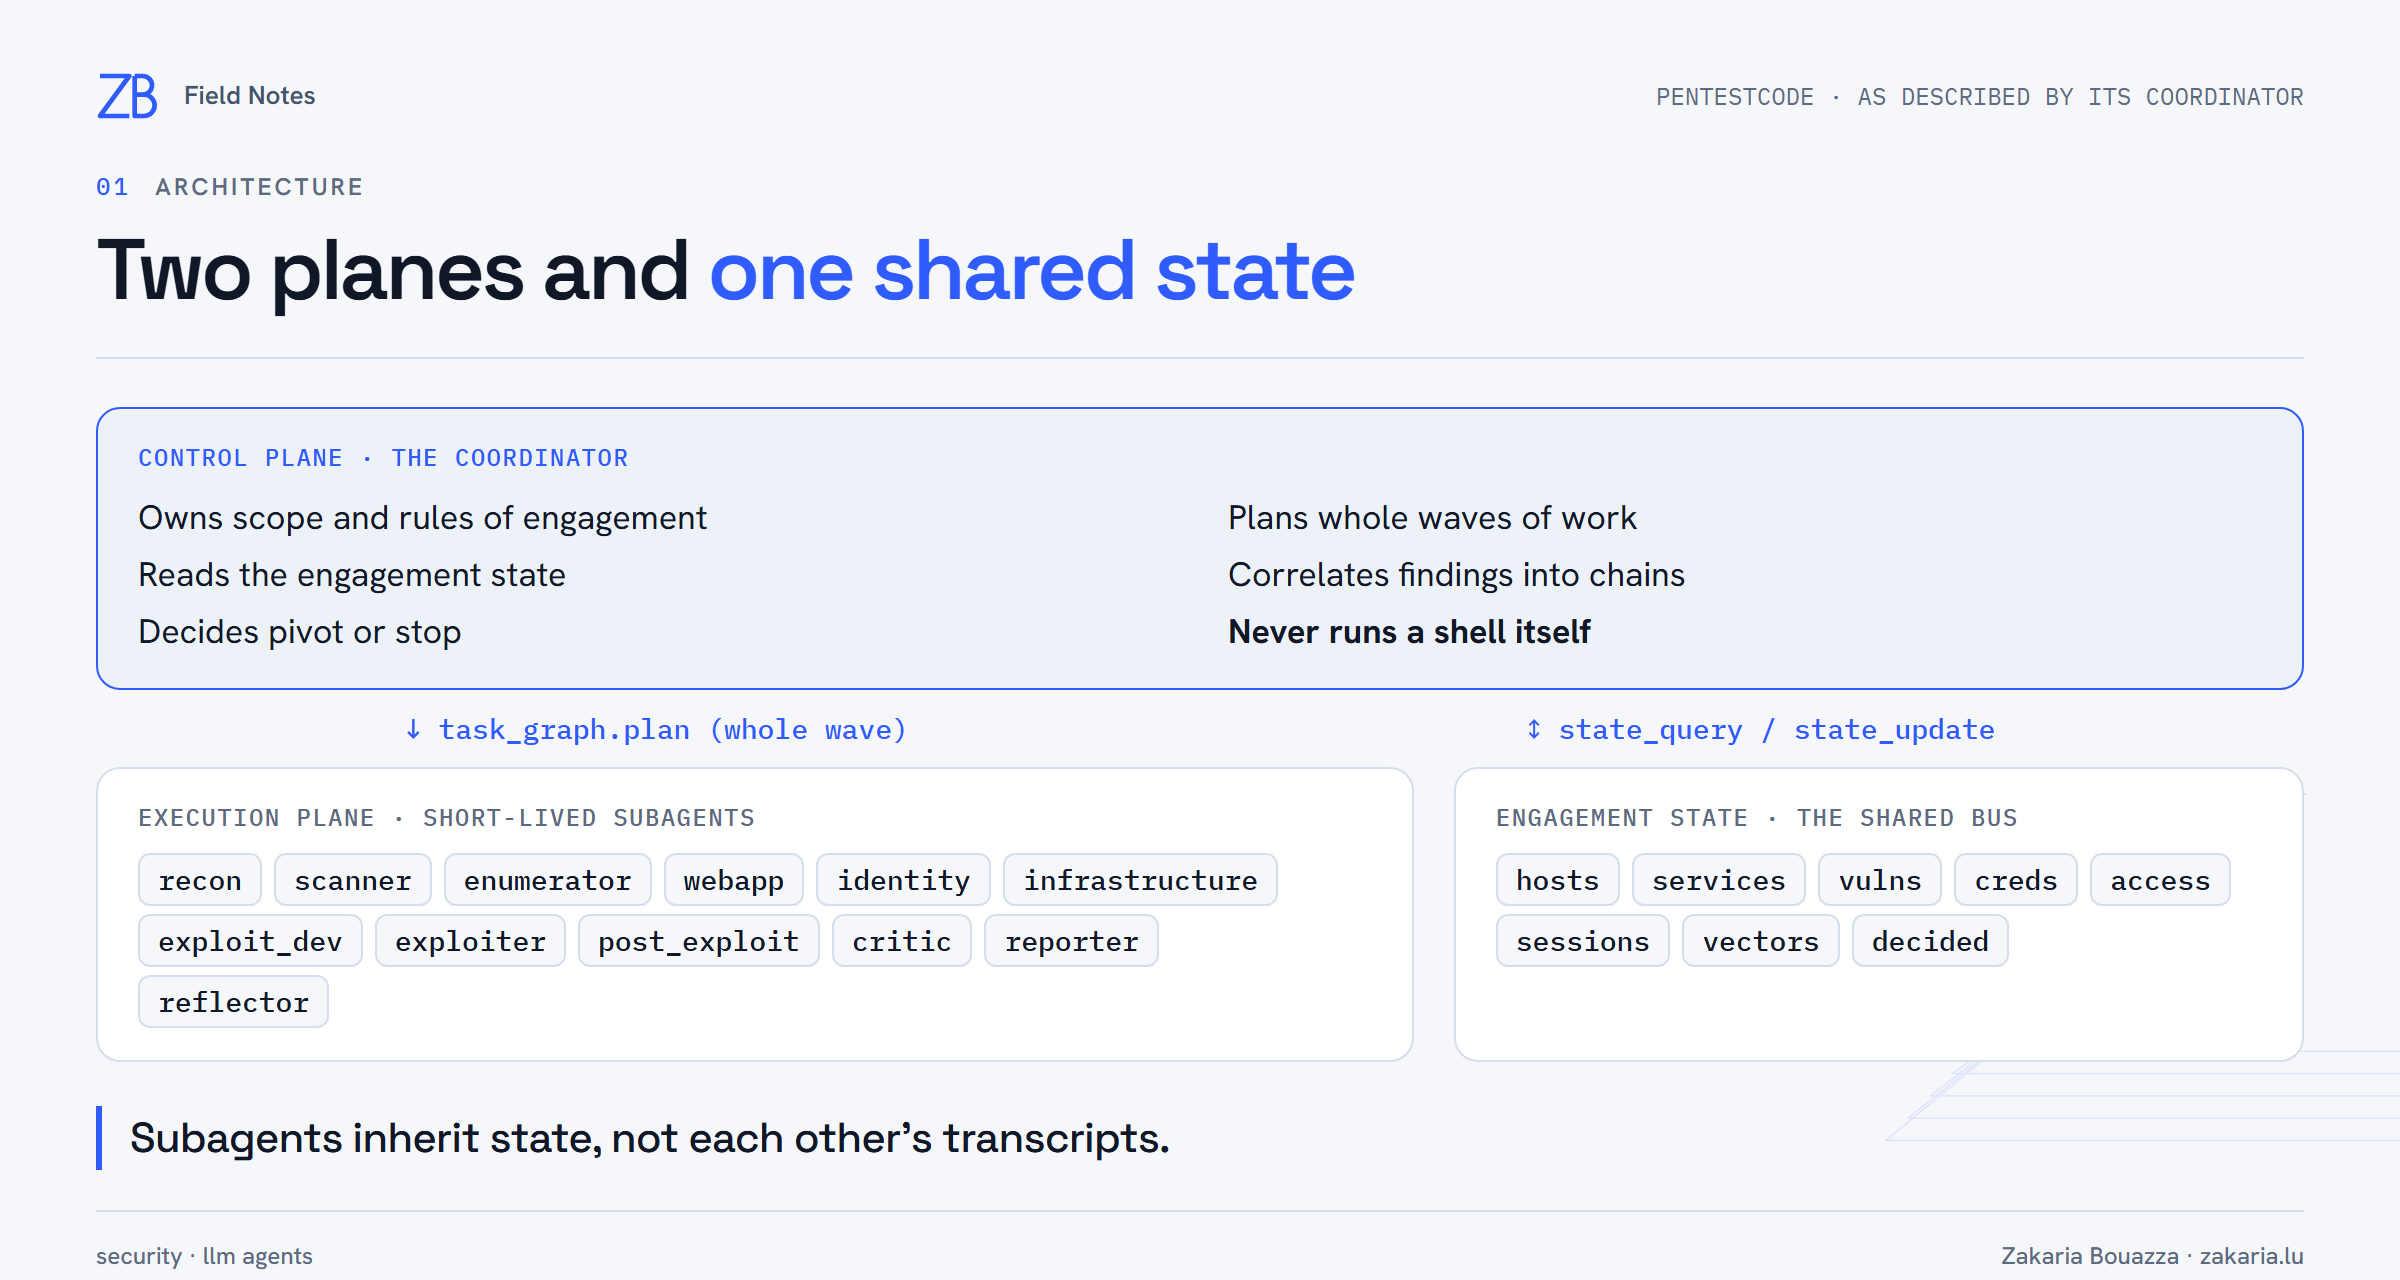
Everything noisy happens in the execution plane. A subagent such as scanner, webapp or identity gets a clean context and a narrow objective. It spends its own tokens and returns a condensed result. The coordinator's context stays small enough to hold the whole engagement. In the agent's words, that is the difference between coordinating five workstreams and drowning in one nmap dump.
The part I would copy into my own agent work is the state store. Subagents don't inherit each other's transcripts. They inherit state: hosts, services, vulnerabilities, credentials, access, sessions, vectors and decisions. The project README describes the same persistent "engagement state", plus parser tools such as nmap_parse and nuclei_parse, and it forbids reading raw nmap output by hand. That is how the identity agent knew an MCP server existed without seeing the recon transcript, and how the critic knew which evidence backed a finding.
Waves, not turns
The loop is observe, orient, decide, delegate, consume. The detail that matters is that all independent work goes out in one plan. On my site the first wave started the full port scan and the Keycloak, MCP, BuildCV and apex/blog investigations together, not one per turn. Dependencies were explicit: blog verification waited for the apex-blog work to finish, so two agents never hit the same surface at once. With a no-DoS rule, that is also a load decision, not only a speed decision.
How the run went
- Recon mapped 11 certificate-transparency names and the real topology: one web host, a third-party mail provider and seven virtual hosts.
- Fan-out ran five agents in parallel against those surfaces.
- Divergence. Most surfaces came back hardened, and the useful signal came from adjacent moves. A Host-header brute force found a virtual host missing from the CT list it had started from. A DNS brute force over 5,042 names proved the zone holds exactly 12 names on 2 IPs.
- Deepening went only where there was signal. The newly found host got a full pass, and the blog got a verification pass.
- Reporting came from state, with a separate section listing the surface that was not tested.
One detail in step 3 is worth being honest about. The coordinator first described that virtual host as "invisible to CT". The final report corrects this: the name was in another CT source, just not in the crt.sh result the run had started from. That correction is what the architecture is for.
The evidence pipeline
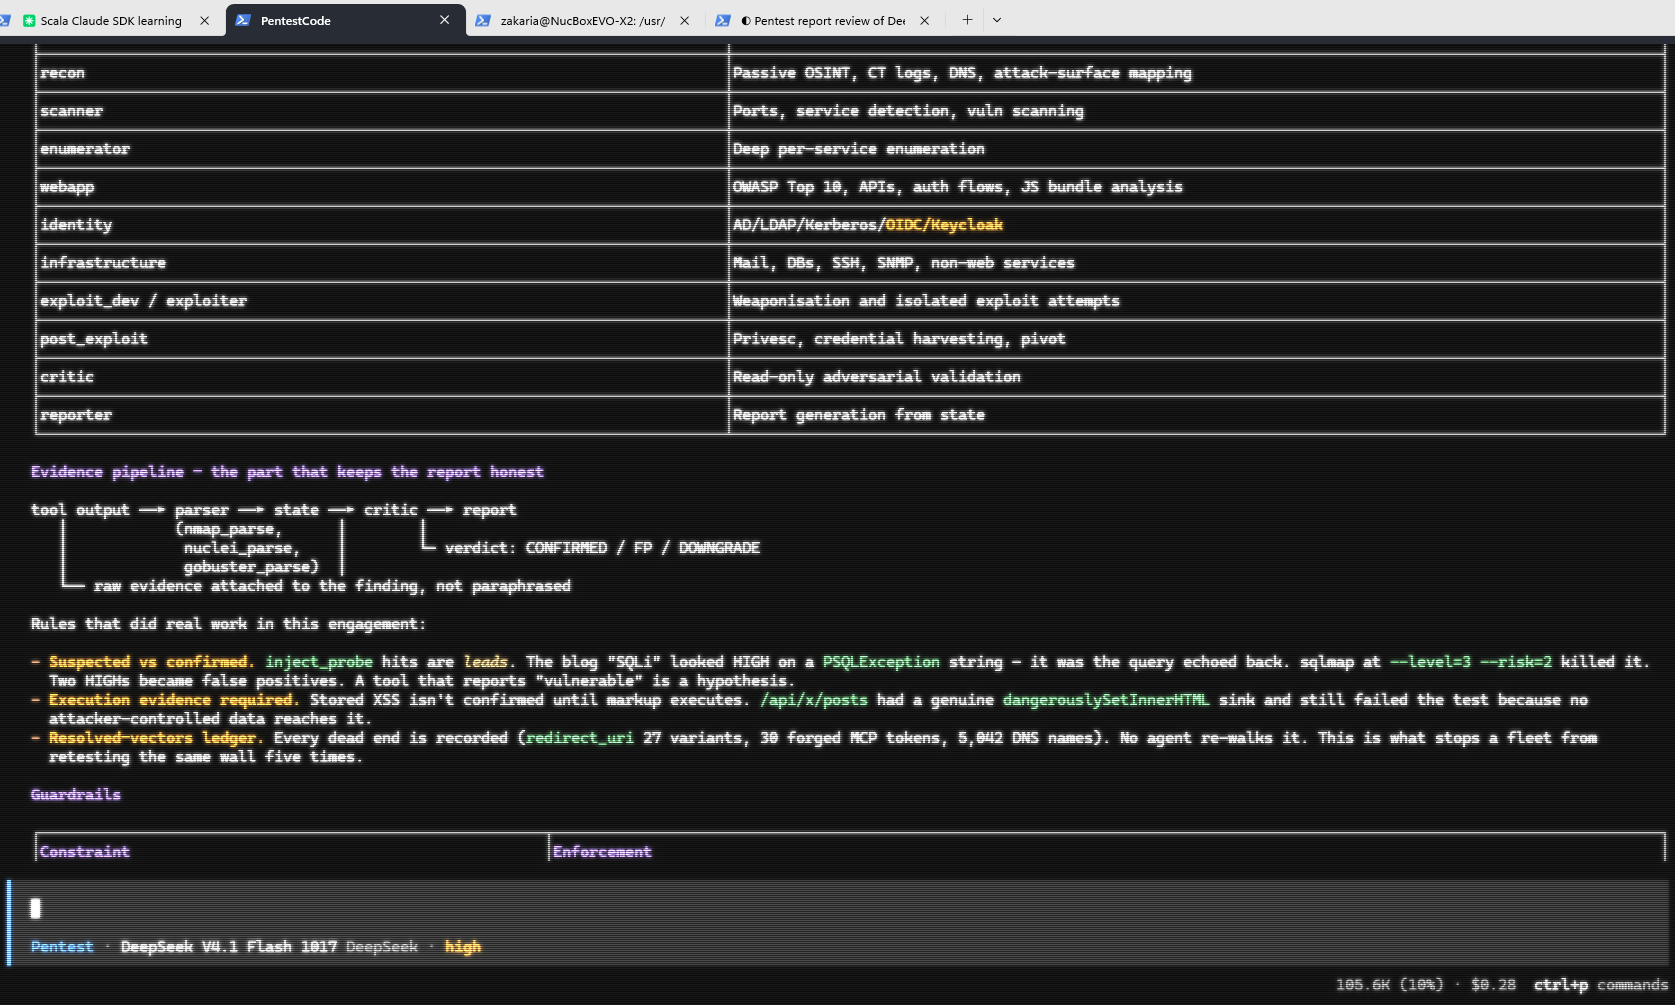
The agent called this "the part that keeps the report honest", and I agree. Tool output goes through a parser into state, with the raw evidence attached rather than paraphrased. A critic then gives every candidate finding a verdict: confirmed, false positive or downgrade. Only after that does the reporter write anything.
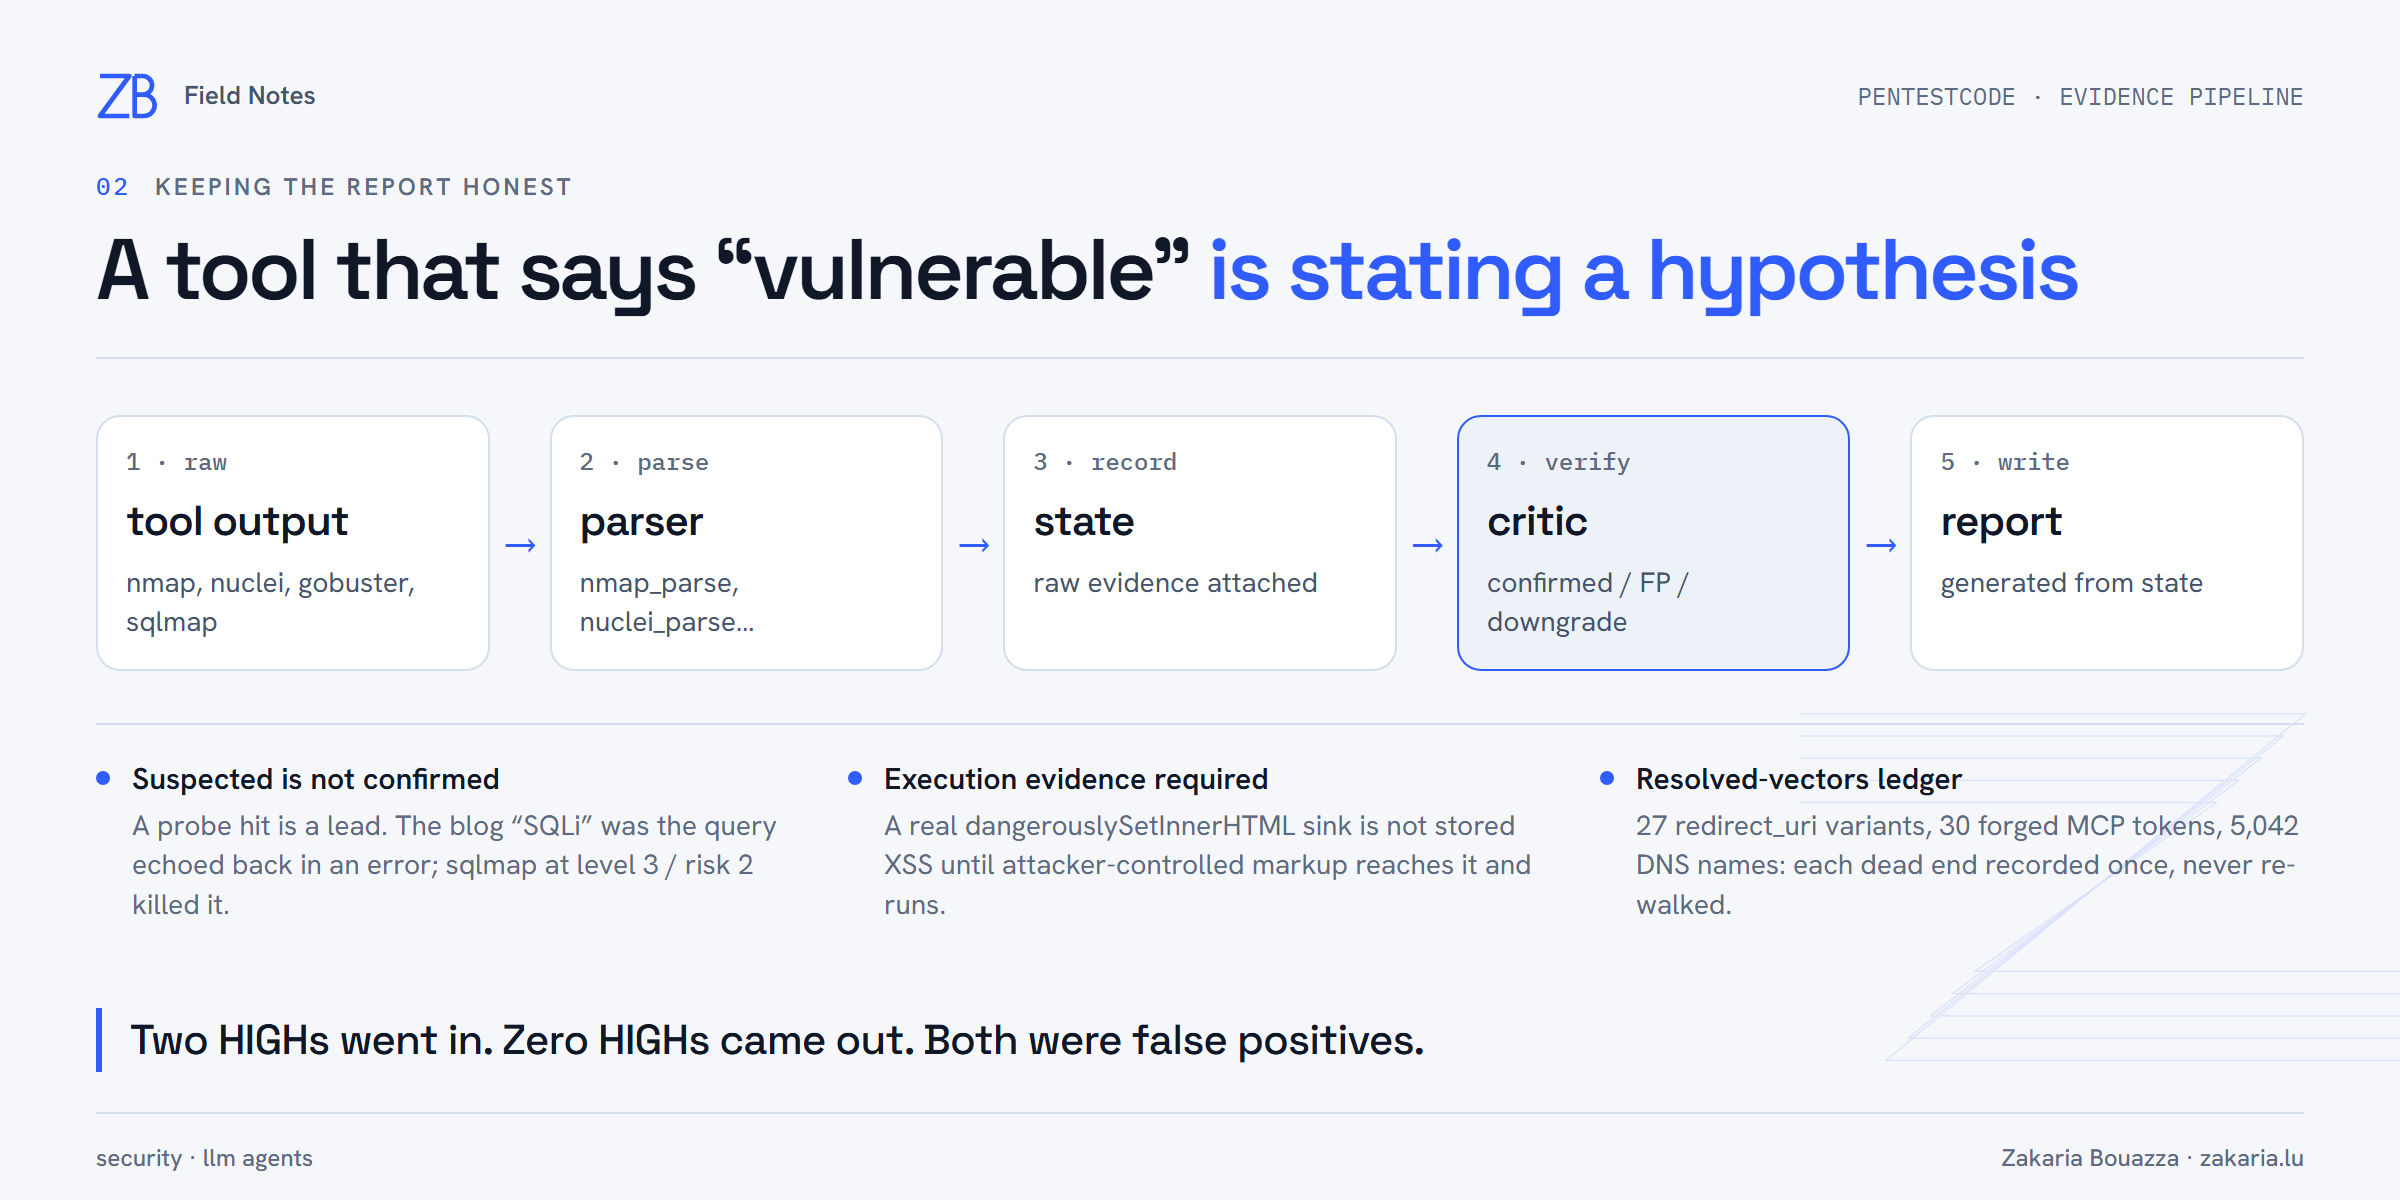
Three rules did real work in this engagement:
- Suspected is not confirmed. An injection probe flagged the blog search as SQL injection because a
PSQLExceptionstring came back in a response. It looked HIGH. It was the query being echoed back. sqlmap at--level=3 --risk=2found nothing, and the finding was dropped. A tool that reports "vulnerable" is stating a hypothesis. - Execution evidence required. The "Notes from X" endpoint feeds HTML into a real
dangerouslySetInnerHTMLsink. It still failed the stored-XSS test, because no attacker-controlled data reaches that sink. A sink alone is not a vulnerability. - A resolved-vectors ledger. Every dead end is recorded once: 27
redirect_urivariants against Keycloak, 30 forged MCP tokens, 5,042 DNS names. No agent walks the same dead end twice.
The two HIGHs that went in as hypotheses both came out as false positives. A single agent working linearly would, in the coordinator's words, have blown its context on the first nmap -p-, retested the same redirect_uri bypass four times, and reported the blog SQLi as HIGH.
Guardrails that matched my rules
My one non-negotiable was no DoS. The agent described how it enforced that: rate caps on nuclei, ffuf and nmap, serialised work per host, and no volumetric tests. Every target passed a scope check, and anything out of scope was reported, not touched. Context blow-up was handled by filtered tool output, parsers and subagent condensation. Self-deception was handled by a critic pass before anything HIGH ships.
The report backs up that last one in a way I appreciated. It ends with a coverage-gaps section, titled so you read it before treating the site as clean, instead of implying a clean bill of health.
What I am taking from it
I have spent a lot of this blog on agent fleets, with Claude Code subagents and Embabel planners on the JVM. PentestCode gives the same lesson from a field where a wrong answer is expensive. Parallelism is the side benefit. The architecture is mostly a machine for not fooling yourself and not repeating yourself:
- keep the planner's context small and give the noise to short-lived workers;
- share state between agents, not transcripts;
- parse tool output into structure before any model reasons about it;
- make a critic that is allowed to say no the only way into the report;
- record dead ends, so the fleet does not retest the same wall five times.
The findings themselves will get their own posts once they are fixed.